Assessment |
Biopsychology |
Comparative |
Cognitive |
Developmental |
Language |
Individual differences |
Personality |
Philosophy |
Social |
Methods |
Statistics |
Clinical |
Educational |
Industrial |
Professional items |
World psychology |
Statistics: Scientific method · Research methods · Experimental design · Undergraduate statistics courses · Statistical tests · Game theory · Decision theory
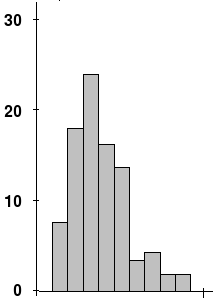
Example of the experimental data with non-zero skewness )
In probability theory and statistics, skewness is a measure of the asymmetry of the probability distribution of a real-valued random variable.
Introduction
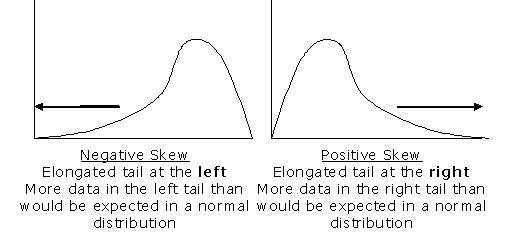
Consider the distribution in the figure. The bars on the right side of the distribution taper differently than the bars on the left side. These tapering sides are called tails, and they provide a visual means for determining which of the two kinds of skewness a distribution has:
- positive skew: The right tail is the longest; the mass of the distribution is concentrated on the left of the figure. The distribution is said to be right-skewed.
- negative skew: The left tail is the longest; the mass of the distribution is concentrated on the right of the figure. The distribution is said to be left-skewed.
Definition
Skewness, the third standardized moment, is written as and defined as


where is the third moment about the mean and is the standard deviation. Equivalently, skewness can be defined as the ratio of the third cumulant and the third power of the square root of the second cumulant :


This is analogous to the definition of kurtosis, which is expressed as the fourth cumulant divided by the fourth power of the square root of the second cumulant.
For a sample of n values the sample skewness is

where is the ith value, is the sample mean, is the sample third central moment, and is the sample variance.


Given samples from a population, the equation for the sample skewness above is a biased estimator of the population skewness. The usual estimator of skewness is


where is the unique symmetric unbiased estimator of the third cumulant and is the symmetric unbiased estimator of the second cumulant. Unfortunately is, nevertheless, generally biased. Its expected value can even have the opposite sign from the true skewness.


The skewness of a random variable X is sometimes denoted Skew[X]. If Y is the sum of n independent random variables, all with the same distribution as X, then it can be shown that Skew[Y] = Skew[X] / √n.
Skewness has benefits in many areas. Many simplistic models assume normal distribution i.e. data is symmetric about the mean. But in reality, data points are not perfectly symmetric. So, an understanding of the skewness of the dataset indicates whether deviations from the mean are going to be positive or negative.
Pearson skewness coefficients
Karl Pearson suggested two simpler calculations as a measure of skewness:
- (mean - mode) / standard deviation
- 3 (mean - median) / standard deviation
There is no guarantee that these will be the same sign as each other or as the ordinary definition of skewness.
See also
- Skewness risk
- Kurtosis
- Kurtosis risk
- Shape parameters
| This page uses Creative Commons Licensed content from Wikipedia (view authors). |