Assessment |
Biopsychology |
Comparative |
Cognitive |
Developmental |
Language |
Individual differences |
Personality |
Philosophy |
Social |
Methods |
Statistics |
Clinical |
Educational |
Industrial |
Professional items |
World psychology |
Social psychology: Altruism · Attribution · Attitudes · Conformity · Discrimination · Groups · Interpersonal relations · Obedience · Prejudice · Norms · Perception · Index · Outline

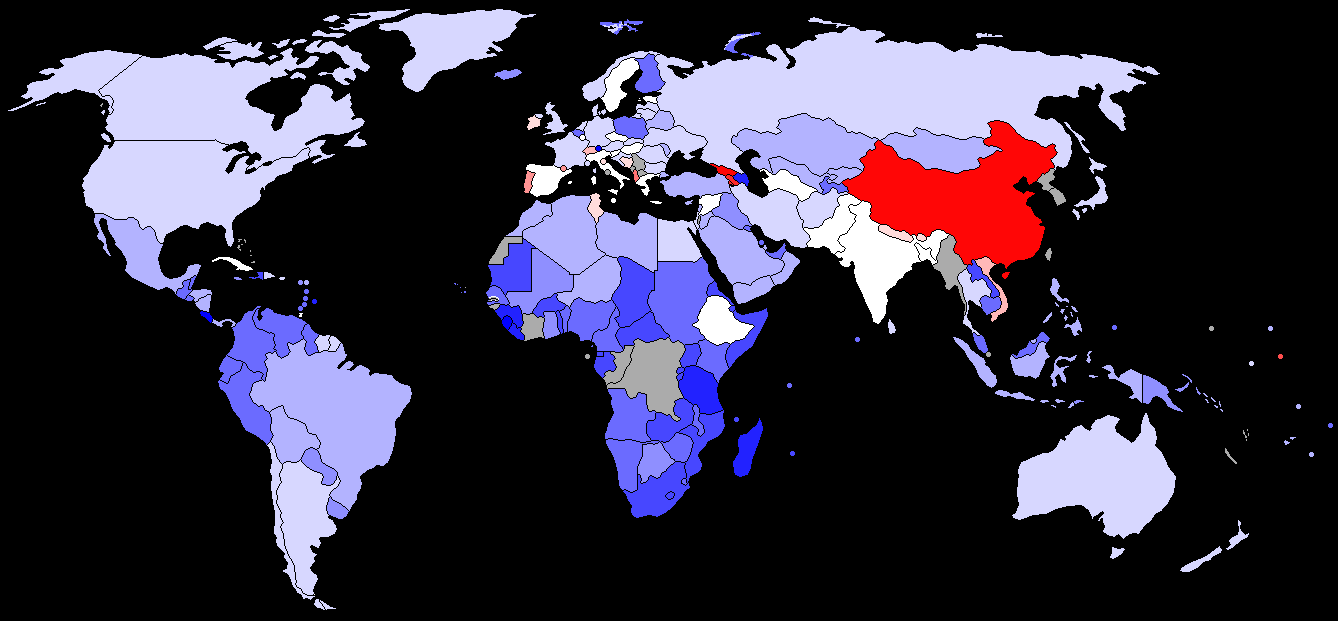
Sex ratio by country for total population. Blue represents more women, red more men than the world average of 1.01 males/female.
Sex ratio by country population aged below 15. Blue represents more women, red more men than the world average of 1.06 males/female.
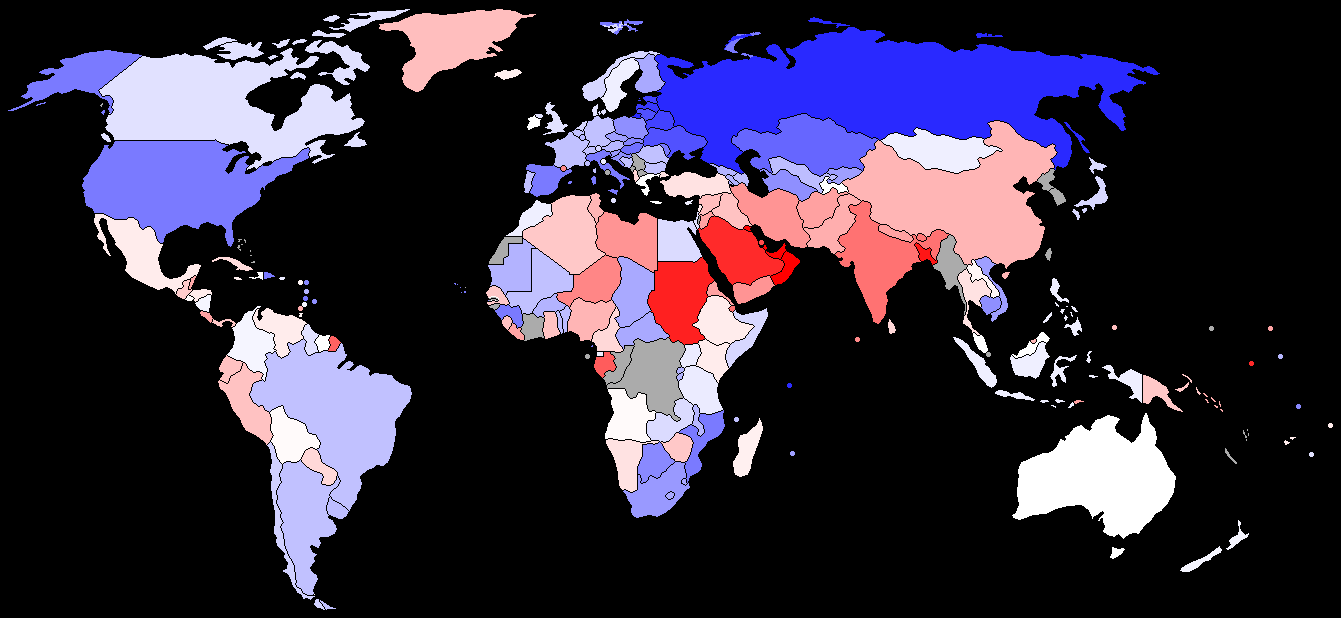
Sex ratio by country for population above 65. Blue represents more women, red more men than the world average of 0.79 males/female.
Sex ratio is the ratio of males to females in a population. The primary sex ratio is the ratio at the time of conception, secondary sex ratio is the ratio at time of birth, and tertiary sex ratio is the ratio of mature organisms.[1] In humans the secondary sex ratio is commonly assumed to be 105 boys to 100 girls (which by convention is referred to as a ratio of 105). In human societies, however, sex ratios at birth or among infants may be considerably skewed by sex-selective abortion and infanticide.
In biology, sex ratio is defined as the proportion of males in the population.
Natural ratio
The natural sex ratio at conception is estimated close to 1.05 males/female (this is related to the weight ratio of X to Y chromosomes) [How to reference and link to summary or text]. Due to the universally higher life expectancy of females, sex ratio tends to even out in adult population, and result in an excess of females among the elderly (e.g., the male to female ratio falls from 1.05 for the group aged 15 to 65 to 0.70 for the group over 65 in Germany, from 1.00 to 0.72 in the USA, from 1.06 to 0.91 in mainland China and from 1.07 to 1.02 in India).
Even in the absence of sex selection practices, a range of "normal" sex ratios at birth of between 103 to 107 boys per 100 girls has been observed in different societies, and among different ethnic and racial groups within a given society. Darwin, in his The Descent of Man, and Selection in Relation to Sex, cites a sex ratio of 120 boys to 100 girls for Jewish communities in 19th century Livonia, where infanticide is not historically documented, and the means for pre-natal sex determination did not exist. Still, more extreme ratios documented in some populations should be attributed rather more to cultural preferences than to biological variation in the propensity to bear boys or girls.
In the United States, the sex ratios at birth over the period 1970-2002 were 105 for the white non-Hispanic population, 104 for Mexican Americans, 103 for African Americans and Indians, and 107 for mothers of Chinese or Filipino ethnicity.[2] Among European countries ca. 2001, the ratios ranged between 104 in Belgium and 107 in Portugal. In the aggregated results of 56 Demographic and Health Surveys[1] in African countries, the ratio is 103, though there is also considerable country-to-country variation.[3]
Negative feedback, regulating population sex ratio
The negative feedback is responsible for increased boy’s birth rates during war-times and also in harems. It realizes through different levels of sexual activity, differential gamete aging and elimination and amount of pollen in plants. The concept was proposed by V. Geodakian in 1965 and confirmed using many plant, animal species and also on humans.[4][5][6] [2]
Factors affecting sex ratio in humans
Genetic
Males and females are produced in approximately equal numbers in most species with separate sexes, regardless of the mechanism of sex determination.
R.A. Fisher, in his 1930 book The Genetical Theory of Natural Selection outlined a model that explains the (approximately) 1:1 sex ratio commonly seen.[7] Fisher's argument goes as follows (cf. The Genetical Theory of Natural Selection, pp. 142-143): Parents incur some level of expenditure to raise offspring. The reproductive value of male offspring is equal to the reproductive value of female offspring, since each individual of the following generation has exactly one male and one female parent. It follows that parental expenditures for males and females are equal. For, if, say, the parental expenditure for males were less than the parental expenditure for females, then a parent with a congenital bias to generate male offspring would produce, for the same amount of parental expenditure, offspring with a lower reproductive value than a parent with a "female bias" would. Hence the sex ratio would be raised until parental expenditures for males and females become equal. It follows that, if parental expenditure for individual male and female offspring are roughly the same (as is the case, for example, in humans), then the sex ratio is approximately 1:1, or 1/2 by the definition commonly used in biology.
| This section may require cleanup to meet Wikipedia's quality standards. Please improve this article if you can. |
Stephen Jay Gould, in his 2002, 1,433 page tome, "The Structure of Evolutionary Theory" devotes four pages (648-649, 678, and 692) to the topic of sex ratio.
Richard Dawkins, author of the 2004, 673 page volume, "The Ancestor's Tale," devotes two pages, pages 203-204, to the topic of male-female ratio.
Environmental
Higher incidence of Hepatitis B virus in populations is believed to increase the sex ratio while some unexplained environmental health hazards are thought to have the opposite effect. [8] However, as noted in the Social Factors section below, it is important to exclude alternative explanations, including social ones, when examining large human populations whose composition by ethnicity and race may be changing.
Other factors that may (or may not) affect the sex ratio include:
- Social status of the mother [9]
- Whether the mother smokes [5]
- Maternal malnutrition [6]
- Whether the mother has a partner or other support network [7]
Social
Data sources and data quality issues. Sex ratios at birth for human societies may be unusual not only because of cultural preferences and social practices that favor the birth or survival of one sex over the other (more often favoring males than favoring females) but also because of incomplete or inaccurate reporting or recording of the births or the survival of infants. Even what constitutes a live birth or infant death may vary from one society to another. For example, for most of the 20th century in Russia (and the Soviet Union), extremely premature newborns (less than 28 weeks gestational age, or less than 1000 grams in weight, or less than 35 centimeters in length) were not counted as a live birth until they had survived 7 days; and if that infant died in that first 168 hours it would not be counted as an infant death. Such a practice led to serious underestimation of the Infant mortality rate (by 22 to 25 percent) relative to standards recommended by the World Health Organization.[10]
When unusual sex ratios at birth (or any other age) are observed, it is important to examine misreporting, misrecording, or underregistration of births or deaths as a possible explanatory factor. Some researchers have attributed the highly masculine sex ratios observed in mainland China in the last 25 years in part to the underreporting of the births of female children after the implementation of the one-child policy, though alternative explanations are now generally more widely accepted, including above all the use of ultrasound technology and sex-selective abortion of female fetuses and, probably to a more limited degree, neglect or in some cases infanticide of females. In the case of China, because of deficiencies in the vital statistics registration system studies of sex ratios at birth have relied either on special fertility surveys, whose accuracy depends on whether the respondents fully report the births and survival of both male and female infants, or on the national population census for which both birth rates and death rates are calculated from the household’s reporting of births and deaths that occurred in the 18 months preceding the census.[11] To the extent that household underreporting of births or deaths is sex-selective, both fertility surveys and censuses may inaccurately reflect the actual sex ratios at birth.[12]
Illustrations of Social Factors at Work. Sex-selective abortion and infanticide are thought to significantly skew the naturally occurring ratio in some populations. These practices are said to be based on a strong cultural preference for one sex -- typically males -- over the other. Reported sex ratios at birth -- outside the typical range of 103:100 to 107:100 -- thus call for an explanation of some kind. In other populations that have witnessed declining sex ratios, researchers have suggested that ecological factors may be at work. In all such reports, it is important to exclude plausible alternative explanations.
As an example of how the social composition of a human society may produce seemingly unusual changes in sex ratios, we can take a study in several counties of California where declining sex ratios had been observed. Smith and Von Behren observe that: "In the raw data, the male birth proportion is indeed declining. However, during this period, there were also shifts in demographics that influence the sex ratio. Controlling for birth order, parents’ age, and race/ethnicity, different trends emerged. White births (which account for over 80%) continued to show a statistically significant decline, while other racial groups showed non-statistically significant declines (Japanese, Native American, other), little or no change (black), or an increase (Chinese). Finally, when the white births were divided into Hispanic and non-Hispanic (possible since 1982), it was found that both white subgroups suggest an increase in male births." They concluded "that the decline in male births in California is largely attributable to changes in demographics." [13]
Gender imbalance
Gender imbalance is a demographic effect that may arise either as a consequence of warfare (excess of females, notably in the wake of WWI in western Europe, and WWII, particularly in the Soviet Union) or of Sex-selective abortion and infanticide (excess of males, notably in mainland China as a result of the one-child policy, or in India). Gender imbalance may result in social unrest, especially in the case of an excess of young males unable to find a spouse.
The Northern Mariana Islands have the highest female ratio with 0.77 males/female. Qatar has the highest male ratio, with 1.87 males/female. For the group aged below 15, Sierra Leone has the highest female ratio with 0.96 males/female, and Georgia and the People's Republic of China are tied for the highest male ratio with 1.13 males/female (according to the 2006 CIA World factbook).
The value for the entire world population is 1.01 males/female, with 1.06 at birth, still 1.06 for those under 15, 1.03 for those between 15 and 64, and 0.79 for those over 65.
Note that the "First World" G7 members all have a gender ratio in the range of 0.95–0.98 for the total population, of 1.05–1.07 at birth, of 1.05–1.06 for the group below 15, of 1.00–1.04 for the group aged 15–64, and of 0.70–0.75 for those over 65.
Countries on the Arabian peninsula tend to have a 'natural' ratio of ca. 1.05 at birth but a very high rate of males for those over 65 (Saudi Arabia 1.13, Arab Emirates 2.73, Qatar 2.84), indicating an above average mortality of females. Conversely, countries of Eastern Europe (the Baltic states, Belorussia, Ukraine, Russia) tend to have a 'normal' ratio at birth but a very low rate of males for those over 65 (Russia 0.46, Latvia 0.48, Ukraine 0.52); similarly, Armenia has a far above average male rate at birth (1.17), and a below average male rate above 65 (0.67). This effect may be caused by emigration of males as well as by higher male mortality.
List of sex ratios by country
According to the 2006 CIA World Factbook [8].
| country | total | at birth | under 15 | 15–65 | over 65 |
|---|---|---|---|---|---|
| Northern Mariana Islands | 0.77 | 1.06 | 1.1 | 0.7 | 1.05 |
| Estonia | 0.84 | 1.06 | 1.06 | 0.91 | 0.5 |
| Russia | 0.86 | 1.06 | 1.05 | 0.94 | 0.46 |
| Latvia | 0.86 | 1.05 | 1.05 | 0.94 | 0.48 |
| Ukraine | 0.86 | 1.07 | 1.05 | 0.92 | 0.52 |
| Belarus | 0.88 | 1.05 | 1.04 | 0.95 | 0.5 |
| Lithuania | 0.89 | 1.06 | 1.05 | 0.96 | 0.52 |
| Armenia | 0.9 | 1.17 | 1.12 | 0.88 | 0.67 |
| Hungary | 0.91 | 1.06 | 1.06 | 0.97 | 0.57 |
| Monaco | 0.91 | 1.05 | 1.05 | 0.97 | 0.69 |
| Virgin Islands | 0.91 | 1.06 | 1.02 | 0.9 | 0.79 |
| Moldova | 0.91 | 1.05 | 1.04 | 0.93 | 0.59 |
| Georgia | 0.91 | 1.15 | 1.13 | 0.93 | 0.67 |
| Macau | 0.92 | 1.05 | 1.07 | 0.91 | 0.72 |
| Puerto Rico | 0.92 | 1.05 | 1.05 | 0.92 | 0.76 |
| San Marino | 0.92 | 1.09 | 1.07 | 0.93 | 0.76 |
| Aruba | 0.93 | 1.05 | 1.05 | 0.95 | 0.69 |
| Netherlands Antilles | 0.93 | 1.05 | 1.05 | 0.92 | 0.7 |
| Bulgaria | 0.93 | 1.06 | 1.05 | 0.97 | 0.7 |
| Seychelles | 0.93 | 1.03 | 1.02 | 0.95 | 0.47 |
| Kazakhstan | 0.93 | 1.06 | 1.04 | 0.96 | 0.55 |
| Croatia | 0.93 | 1.06 | 1.05 | 0.99 | 0.62 |
| Guinea | 0.94 | 1.03 | 1 | 0.92 | 0.72 |
| Sierra Leone | 0.94 | 1.03 | 0.96 | 0.92 | 0.89 |
| Poland | 0.94 | 1.06 | 1.06 | 0.99 | 0.62 |
| Lebanon | 0.94 | 1.05 | 1.04 | 0.92 | 0.83 |
| Barbados | 0.94 | 1.01 | 1 | 0.97 | 0.62 |
| Slovakia | 0.94 | 1.05 | 1.05 | 0.99 | 0.6 |
| Guernsey | 0.94 | 1.04 | 1.03 | 0.98 | 0.73 |
| Isle of Man | 0.95 | 1.05 | 1.05 | 1.01 | 0.68 |
| Japan | 0.95 | 1.05 | 1.05 | 1.01 | 0.73 |
| South Africa | 0.95 | 1.02 | 1.01 | 0.95 | 0.63 |
| Liechtenstein | 0.95 | 1.01 | 0.98 | 0.99 | 0.73 |
| Tuvalu | 0.95 | 1.05 | 1.04 | 0.95 | 0.61 |
| Lesotho | 0.95 | 1.03 | 1.01 | 0.94 | 0.66 |
| Austria | 0.95 | 1.05 | 1.05 | 1.01 | 0.68 |
| El Salvador | 0.95 | 1.05 | 1.04 | 0.91 | 0.8 |
| Portugal | 0.95 | 1.07 | 1.09 | 0.98 | 0.7 |
| Cambodia | 0.95 | 1.05 | 1.02 | 0.94 | 0.62 |
| Uruguay | 0.95 | 1.04 | 1.03 | 0.98 | 0.69 |
| Cape Verde | 0.95 | 1.03 | 1.02 | 0.95 | 0.59 |
| France | 0.95 | 1.05 | 1.05 | 1 | 0.7 |
| Czech Republic | 0.95 | 1.06 | 1.06 | 1.01 | 0.64 |
| Slovenia | 0.95 | 1.07 | 1.06 | 1.02 | 0.63 |
| Swaziland | 0.95 | 1.03 | 1.02 | 0.92 | 0.66 |
| Romania | 0.95 | 1.06 | 1.05 | 0.99 | 0.7 |
| Italy | 0.96 | 1.07 | 1.06 | 1.02 | 0.72 |
| Ethiopia | 0.96 | 1.03 | 1.06 | 1.01 | 0.83 |
| Mexico | 0.96 | 1.05 | 1.04 | 0.94 | 0.83 |
| Azerbaijan | 0.96 | 1.05 | 1 | 0.97 | 0.69 |
| Spain | 0.96 | 1.07 | 1.06 | 1.01 | 0.72 |
| Singapore | 0.96 | 1.08 | 1.07 | 0.95 | 0.8 |
| Colombia | 0.96 | 1.03 | 1.02 | 0.95 | 0.78 |
| Bermuda | 0.96 | 1.02 | 1.01 | 0.98 | 0.77 |
| Sri Lanka | 0.96 | 1.05 | 1.05 | 0.94 | 0.86 |
| Kyrgyzstan | 0.96 | 1.05 | 1.04 | 0.96 | 0.64 |
| Chad | 0.96 | 1.04 | 1.01 | 0.92 | 0.66 |
| Botswana | 0.96 | 1.03 | 1.03 | 0.94 | 0.61 |
| Belgium | 0.96 | 1.05 | 1.04 | 1.02 | 0.7 |
| Equatorial Guinea | 0.96 | 1.03 | 1.01 | 0.93 | 0.77 |
| Germany | 0.96 | 1.06 | 1.05 | 1.04 | 0.7 |
| Cayman Islands | 0.96 | 1.02 | 1 | 0.95 | 0.89 |
| Finland | 0.96 | 1.04 | 1.04 | 1.02 | 0.66 |
| Togo | 0.96 | 1.03 | 1.01 | 0.95 | 0.69 |
| Hong Kong | 0.96 | 1.08 | 1.1 | 0.95 | 0.87 |
| Montserrat | 0.96 | 1.05 | 1.04 | 0.91 | 1.06 |
| Greece | 0.96 | 1.06 | 1.06 | 1 | 0.79 |
| Saint Lucia | 0.97 | 1.07 | 1.07 | 0.97 | 0.58 |
| Argentina | 0.97 | 1.05 | 1.05 | 1 | 0.7 |
| Haiti | 0.97 | 1.03 | 1.01 | 0.96 | 0.79 |
| Mauritius | 0.97 | 1.02 | 1.01 | 1 | 0.64 |
| Bosnia and Herzegovina | 0.97 | 1.07 | 1.07 | 1.02 | 0.7 |
| Switzerland | 0.97 | 1.05 | 1.08 | 1.02 | 0.7 |
| Luxembourg | 0.97 | 1.07 | 1.06 | 1.02 | 0.68 |
| United States | 0.97 | 1.05 | 1.05 | 1 | 0.72 |
| Burma | 0.97 | 1.06 | 1.02 | 0.97 | 0.76 |
| Mozambique | 0.97 | 1.03 | 1.01 | 0.94 | 0.72 |
| Guadeloupe | 0.97 | 1.05 | 1.05 | 0.99 | 0.71 |
| Jersey | 0.97 | 1.08 | 1.08 | 0.99 | 0.79 |
| Norway | 0.98 | 1.05 | 1.05 | 1.03 | 0.73 |
| Sweden | 0.98 | 1.06 | 1.06 | 1.03 | 0.77 |
| Tanzania | 0.98 | 1.03 | 1 | 0.97 | 0.76 |
| Uzbekistan | 0.98 | 1.05 | 1.04 | 0.98 | 0.69 |
| Chile | 0.98 | 1.05 | 1.05 | 1 | 0.72 |
| Reunion | 0.98 | 1.05 | 1.05 | 0.98 | 0.69 |
| Benin | 0.98 | 1.03 | 1.02 | 0.97 | 0.69 |
| Central African Republic | 0.98 | 1.03 | 1.01 | 0.98 | 0.66 |
| United Kingdom | 0.98 | 1.05 | 1.05 | 1.02 | 0.75 |
| Bolivia | 0.98 | 1.05 | 1.04 | 0.96 | 0.8 |
| Vietnam | 0.98 | 1.07 | 1.08 | 0.98 | 0.64 |
| Turkmenistan | 0.98 | 1.05 | 1.06 | 0.96 | 0.62 |
| Canada | 0.98 | 1.05 | 1.05 | 1.01 | 0.75 |
| Brazil | 0.98 | 1.05 | 1.04 | 0.98 | 0.7 |
| Denmark | 0.98 | 1.06 | 1.05 | 1.02 | 0.75 |
| Jamaica | 0.98 | 1.05 | 1.03 | 0.97 | 0.82 |
| Laos | 0.98 | 1.04 | 1.01 | 0.98 | 0.81 |
| Thailand | 0.98 | 1.05 | 1.05 | 0.98 | 0.84 |
| Netherlands | 0.98 | 1.05 | 1.05 | 1.02 | 0.73 |
| Mauritania | 0.98 | 1.03 | 1.01 | 0.97 | 0.67 |
| Mali | 0.98 | 1.03 | 1.03 | 0.96 | 0.7 |
| Sao Tome and Principe | 0.98 | 1.03 | 1.03 | 0.94 | 0.85 |
| Saint Kitts and Nevis | 0.99 | 1.06 | 1.05 | 1 | 0.71 |
| Australia | 0.99 | 1.05 | 1.05 | 1.02 | 0.79 |
| Rwanda | 0.99 | 1.03 | 1.01 | 0.99 | 0.67 |
| Israel | 0.99 | 1.05 | 1.05 | 1.01 | 0.75 |
| Ireland | 0.99 | 1.07 | 1.07 | 1 | 0.79 |
| Tonga | 0.99 | 1.05 | 1.04 | 0.98 | 0.75 |
| New Zealand | 0.99 | 1.04 | 1.05 | 1.01 | 0.78 |
| Cuba | 0.99 | 1.06 | 1.06 | 1 | 0.85 |
| Tajikistan | 0.99 | 1.05 | 1.02 | 0.99 | 0.79 |
| Martinique | 0.99 | 1.02 | 1.03 | 1 | 0.82 |
| Malta | 0.99 | 1.06 | 1.06 | 1.02 | 0.75 |
| Malawi | 0.99 | 1.03 | 1.02 | 0.98 | 0.68 |
| Liberia | 0.99 | 1.03 | 1 | 0.98 | 0.94 |
| Eritrea | 0.99 | 1.03 | 1.01 | 0.98 | 0.95 |
| Madagascar | 0.99 | 1.03 | 1 | 0.98 | 0.82 |
| Guatemala | 0.99 | 1.05 | 1.04 | 0.97 | 0.87 |
| Morocco | 0.99 | 1.05 | 1.04 | 0.99 | 0.77 |
| Burundi | 0.99 | 1.03 | 1.01 | 0.99 | 0.67 |
| Burkina Faso | 0.99 | 1.03 | 1.01 | 0.99 | 0.67 |
| Zambia | 0.99 | 1.03 | 1.01 | 0.99 | 0.74 |
| Comoros | 0.99 | 1.03 | 1.01 | 0.98 | 0.7 |
| Cyprus | 1 | 1.05 | 1.04 | 1.03 | 0.77 |
| Antigua and Barbuda | 1 | 1.05 | 1.04 | 1.01 | 0.61 |
| Iceland | 1 | 1.04 | 1.03 | 1.03 | 0.82 |
| Costa Rica | 1 | 1.05 | 0.97 | 1.02 | 0.95 |
| Ecuador | 1 | 1.05 | 1.04 | 0.99 | 0.89 |
| Zimbabwe | 1 | 1.03 | 1.02 | 1 | 0.88 |
| Republic of Macedonia | 1 | 1.08 | 1.07 | 1.02 | 0.78 |
| Philippines | 1 | 1.05 | 1.04 | 0.99 | 0.77 |
| Ghana | 1 | 1.03 | 1.03 | 1 | 0.89 |
| Gabon | 1 | 1.03 | 1.01 | 0.99 | 1.05 |
| Indonesia | 1 | 1.05 | 1.04 | 1 | 0.77 |
| Nicaragua | 1 | 1.05 | 1.04 | 0.99 | 0.78 |
| Mongolia | 1 | 1.05 | 1.04 | 1 | 0.77 |
| Uganda | 1 | 1.03 | 1.01 | 1.01 | 0.76 |
| Senegal | 1 | 1.03 | 1.02 | 0.99 | 0.88 |
| Nauru | 1 | 1.05 | 1.05 | 0.97 | 1.13 |
| Somalia | 1 | 1.03 | 1.01 | 1.01 | 0.73 |
| South Korea | 1.01 | 1.13 | 1.12 | 1.03 | 0.63 |
| Guyana | 1.01 | 1.05 | 1.04 | 1.02 | 0.75 |
| Gibraltar | 1.01 | 1.06 | 1.05 | 1.05 | 0.81 |
| Cameroon | 1.01 | 1.03 | 1.02 | 1.01 | 0.86 |
| Kenya | 1.01 | 1.02 | 1.02 | 1.01 | 0.83 |
| World | 1.01 | 1.06 | 1.06 | 1.03 | 0.79 |
| Kiribati | 1.01 | 1.05 | 1.11 | 1.04 | 0.68 |
| New Caledonia | 1.01 | 1.05 | 1.04 | 1.01 | 0.87 |
| Dominica | 1.01 | 1.05 | 1.02 | 1.06 | 0.67 |
| Peru | 1.01 | 1.05 | 1.04 | 1.01 | 0.89 |
| Malaysia | 1.01 | 1.07 | 1.06 | 1.01 | 0.79 |
| Honduras | 1.01 | 1.05 | 1.04 | 1 | 0.83 |
| Namibia | 1.01 | 1.03 | 1.02 | 1.01 | 0.84 |
| Saint Pierre and Miquelon | 1.01 | 1.07 | 1.05 | 1.03 | 0.84 |
| Paraguay | 1.01 | 1.05 | 1.03 | 1.01 | 0.86 |
| Fiji | 1.01 | 1.05 | 1.04 | 1 | 0.83 |
| Iraq | 1.02 | 1.05 | 1.03 | 1.03 | 0.89 |
| Algeria | 1.02 | 1.05 | 1.04 | 1.02 | 0.88 |
| Angola | 1.02 | 1.05 | 1.02 | 1.03 | 0.8 |
| Panama | 1.02 | 1.05 | 1.04 | 1.03 | 0.88 |
| Venezuela | 1.02 | 1.08 | 1.07 | 1.01 | 0.83 |
| Sudan | 1.02 | 1.05 | 1.04 | 1 | 1.15 |
| Egypt | 1.02 | 1.05 | 1.05 | 1.02 | 0.74 |
| Turkey | 1.02 | 1.05 | 1.04 | 1.03 | 0.84 |
| Nigeria | 1.02 | 1.03 | 1.02 | 1.04 | 0.91 |
| Tunisia | 1.02 | 1.07 | 1.07 | 1.01 | 0.91 |
| Solomon Islands | 1.03 | 1.05 | 1.04 | 1.02 | 0.92 |
| Dominican Republic | 1.03 | 1.05 | 1.05 | 1.04 | 0.87 |
| Saint Helena | 1.03 | 1.05 | 1.04 | 1.06 | 0.84 |
| Anguilla | 1.03 | 1.03 | 1.03 | 1.06 | 0.81 |
| Belize | 1.03 | 1.05 | 1.04 | 1.02 | 0.93 |
| Iran | 1.04 | 1.05 | 1.05 | 1.04 | 0.96 |
| Gaza Strip | 1.04 | 1.05 | 1.05 | 1.04 | 0.71 |
| Marshall Islands | 1.04 | 1.05 | 1.04 | 1.05 | 0.94 |
| Suriname | 1.04 | 1.05 | 1.05 | 1.06 | 0.79 |
| Albania | 1.04 | 1.1 | 1.1 | 1.05 | 0.86 |
| Guam | 1.04 | 1.06 | 1.08 | 1.04 | 0.88 |
| Taiwan | 1.04 | 1.1 | 1.09 | 1.03 | 0.99 |
| Yemen | 1.04 | 1.05 | 1.04 | 1.04 | 0.96 |
| Saint Vincent and the Grenadines | 1.04 | 1.03 | 1.04 | 1.07 | 0.78 |
| West Bank | 1.04 | 1.06 | 1.05 | 1.05 | 0.74 |
| East Timor | 1.04 | 1.05 | 1.03 | 1.04 | 0.95 |
| Papua New Guinea | 1.05 | 1.05 | 1.03 | 1.06 | 0.88 |
| Djibouti | 1.05 | 1.03 | 1.01 | 1.09 | 1.02 |
| Niger | 1.05 | 1.03 | 1.04 | 1.06 | 0.99 |
| Maldives | 1.05 | 1.05 | 1.06 | 1.04 | 0.98 |
| British Virgin Islands | 1.05 | 1.05 | 1.03 | 1.06 | 1.1 |
| Afghanistan | 1.05 | 1.05 | 1.05 | 1.05 | 0.95 |
| Syria | 1.05 | 1.06 | 1.06 | 1.05 | 0.9 |
| Bangladesh | 1.05 | 1.06 | 1.06 | 1.04 | 1.16 |
| Libya | 1.05 | 1.05 | 1.04 | 1.06 | 0.96 |
| Vanuatu | 1.05 | 1.05 | 1.04 | 1.04 | 1.1 |
| Pakistan | 1.05 | 1.05 | 1.06 | 1.05 | 0.92 |
| Faroe Islands | 1.05 | 1 | 1 | 1.12 | 0.83 |
| Nepal | 1.06 | 1.05 | 1.07 | 1.06 | 0.95 |
| American Samoa | 1.06 | 1.06 | 1.08 | 1.08 | 0.59 |
| China | 1.06 | 1.12 | 1.13 | 1.06 | 0.91 |
| India | 1.06 | 1.05 | 1.06 | 1.07 | 1.02 |
| Trinidad and Tobago | 1.07 | 1.05 | 1.06 | 1.1 | 0.81 |
| Turks and Caicos Islands | 1.07 | 1.05 | 1.04 | 1.11 | 0.83 |
| French Polynesia | 1.07 | 1.05 | 1.04 | 1.08 | 1.02 |
| Bhutan | 1.07 | 1.05 | 1.07 | 1.06 | 1.01 |
| Andorra | 1.08 | 1.07 | 1.09 | 1.1 | 0.98 |
| Grenada | 1.08 | 1 | 1.02 | 1.13 | 0.92 |
| Brunei | 1.09 | 1.06 | 1.04 | 1.12 | 0.91 |
| Jordan | 1.1 | 1.06 | 1.04 | 1.15 | 0.95 |
| Mayotte | 1.1 | 1.03 | 1.01 | 1.18 | 1.02 |
| French Guiana | 1.12 | 1.05 | 1.05 | 1.16 | 1.04 |
| Greenland | 1.12 | 1.02 | 1.05 | 1.17 | 0.9 |
| Palau | 1.13 | 1.06 | 1.06 | 1.17 | 0.9 |
| Saudi Arabia | 1.2 | 1.05 | 1.04 | 1.33 | 1.13 |
| Oman | 1.25 | 1.05 | 1.04 | 1.44 | 1.23 |
| Bahrain | 1.26 | 1.03 | 1.02 | 1.38 | 1.07 |
| Samoa | 1.39 | 1.05 | 1.04 | 1.65 | 0.83 |
| United Arab Emirates | 1.43 | 1.05 | 1.04 | 1.55 | 2.73 |
| Kuwait | 1.52 | 1.04 | 1.04 | 1.77 | 1.71 |
| Qatar | 1.87 | 1.05 | 1.04 | 2.24 | 2.84 |
Sex ratio theory
The theory of sex ratio is a field of study concerned with the accurate prediction of sex ratios in all sexual species, based on a consideration of their natural history. The field continues to be heavily influenced by Eric Charnov's 1982 book, Sex Allocation.[14] He defines five major questions, both for his book and the field in general (slightly abbreviated here):
- For a dioecious species, what is the equilibrium sex ratio maintained by natural selection?
- For a sequential hermaphrodite, what is the equilibrium sex order and time of sex change?
- For a simultaneous hermaphrodite, what is the equilibrium allocation of resources to male versus female function in each breeding season?
- Under what conditions are the various states of hermaphroditism or dioecy evolutionarily stable? When is a mixture of sexual types stable?
- When does selection favour the ability of an individual to alter its allocation to male versus female function, in response to particular environmental or life history situations?
Biological research mostly concerns itself with sex allocation rather than sex ratio, sex allocation denoting the allocation of energy to either sex. Common research themes are the effects of local mate and resource competition (often abbreviated LMC and LRC, respectively).
Examples in non-human species
Environmental
The bacterium wolbachia causes skewed sex ratios in some arthropod species as it kills males.
For the copepods the sex ratio is seldom close to 1, but generally in favour of the females.
Economical
Traditionally, farmers have discovered that the most economically efficient community of animals will have a large number of females and a very small number of males. A herd of cows and a few prize bulls or a flock of chickens and one rooster are the most economical sex ratios for domesticated livestock.
References
- ↑ Nancy S. Coney and W. C. Mackey. 1998. "The woman as final arbiter: a case for the facultative character of the human sex ratio," Journal of Sex Research 35 (May): 169-175.
- ↑ T. J. Matthews, et al., "Trend Analysis of the Sex Ratio at Birth in the United States," National Vital Statistics Reports 53, No. 20 (June 2005).
- ↑ Michel Garenne, "Sex ratios at birth in African populations: A review of survey data," Human Biology 74 (December, 2002): 889-900.
- ↑ Geodakyan V. A. (1977). The Amount of Pollen as a Regulator of Evolutionary Plasticity of Cross-Pollinating Plants. “Doklady Biological Sciences” 234 N 1-6, 193–196.
- ↑ Geodakyan V. A. Geodakyan S.V. (1985). Is there a negative feedback in sex determination? “Zurnal obschej biol.” 46 N 2 201-216.
- ↑ Geodakian K. V. Geodakian V. A. (1998). Sex Ratio (M/F) Adjusts Genotypical Evolutionary Plasticity (EP) Of a Population, Sinistrality/Dextrality (S/D)—Its Behavioral EP. The 14th International Congress of Anthropological and Ethnological Sciences. Abstracts July 26-August l, 145.
- ↑ Fisher, R.A. (1930) The Genetical Theory of Natural Selection. Clarendon Press, Oxford.
- ↑ Devra L. Davis, Michelle B. Gottlieb, and Julie R. Stampnitzky. 1998. "Reduced Ratio of Male to Female Births in Several Industrial Countries: A Sentinel Health Indicator?" Journal of the American Medical Association,279 (April): 1018-1023.
- ↑ Mendl M.; Zanella A.J.; Broom D.M.; Whittemore C.T.1. 1995. "Maternal social status and birth sex ratio in domestic pigs: an analysis of mechanisms", Animal Behaviour 50, No. 5: 1361-1370.
- ↑ Barbara A. Anderson and Brian D. Silver. 1986. "Infant Mortality in the Soviet Union: Regional Differences and Measurement Issues," Population and Development Review 12, No. 4: 705-737.
- ↑ For example, the number of births reported to family planning and other administrative agencies has been significantly lower than the number determined in population surveys and the census. See Guangyu Zhang, "Very Low Fertility in China in the 1990s: Reality or An Illusion Arising from Birth Underreporting?," Paper presented at the annual meeting of the Population Association of America, April 2004.
- ↑ For studies reveal underreporting or delayed reporting of female births in China, see M. G. Merli and A. E. Raftery, "Are births underreported in rural China? Manipulation of statistical records in response to China's population policies," Demography 37 (February 1990): 109-126; and Yong Cai and William Lavely, "China’s Missing Girls: Numerical Estimates and Effects on Population Growth," The China Review 3, No. 2 (Fall 2003): 13–29.
- ↑ Daniel Smith and Julie Von Behren. 2005. "Trends in the sex ratio of California births, 1960–1996," Journal of Epidemiology and Community Health 59: 1047-1053.
- ↑ Eric L. Charnov. (1982) Sex allocation. Princeton University Press, Princeton, New Jersey. ISBN 0-691-08312-6
Nishimura, K. & G. C. Jahn 1996. Sex allocation of three solitary ectoparasitic wasp species on bean weevil larvae: sex ratio change with host quality and local mate competition. Journal of Ethology 14 (1): 27-34.
Some General sources
- Coale, Ansley J. (1996). "Five Decades of Missing Females in China," Proceedings of the American Philosophical Society 140 (4): 421-450.
- Hamilton, W.D. (1967). Extraordinary sex ratios. Science 156: 477-488. pubmed JSTOR
- Trivers R. L. & Willard D. E. (1973). Natural selection of parental ability to vary the sex ratio of offspring. Science 170 90-92.
See also
- Sex allocation
- Sex selection
- Demographic transition
- Youth Bulge
- Evolutionary theory of sex
- XY sex-determination system
External links
- Declining sex ratios in industrialized countries - environmental hazards
- Sex ratio in communities with high Hepatitis B favours boys
- CIA listing of sex ratios for individual countries (including age divisions)
- A review of sex ratio theory
- Sex ratio of Marine Planktonic Copepods
- The Evolutionary Theory of Sex: Sex Ratio
- cs:Poměr pohlaví
- de:Geschlechterverteilung
- fr:Sex ratio
- nl:Geslachtsverhouding
- vi:Tỷ lệ giới tính
- zh:性別比
| This page uses Creative Commons Licensed content from Wikipedia (view authors). |