m (Reverted edits by 69.143.226.129 (Talk); changed back to last version by Dr Joe Kiff) |
No edit summary |
||
| (2 intermediate revisions by the same user not shown) | |||
| Line 1: | Line 1: | ||
{{DevPsy}} |
{{DevPsy}} |
||
| + | {{PsyPerspective}} |
||
| − | |||
[[Image:Life expectancy world map.PNG|thumb|World map of life expectancy, 2005]] |
[[Image:Life expectancy world map.PNG|thumb|World map of life expectancy, 2005]] |
||
| Line 8: | Line 8: | ||
Life expectancy is heavily dependent on the criteria used to select the group. In countries with high [[infant mortality]] rates, the life expectancy at birth is highly sensitive to the rate of death in the first few years of life. In these cases, another measure such as life expectancy at age 5 (e<sub>5</sub>) can be used to exclude the effects of infant mortality to reveal the effects of other causes of death. Typically, life expectancy at birth (e<sub>0</sub>) is specified. If the data on [[infant mortality rate]]s are suspect for some reason, such as the underreporting of births or of infant deaths, then life expectancy at age 1 (e<sub>1</sub>) or age 2 (e<sub>2</sub>) might also be used. |
Life expectancy is heavily dependent on the criteria used to select the group. In countries with high [[infant mortality]] rates, the life expectancy at birth is highly sensitive to the rate of death in the first few years of life. In these cases, another measure such as life expectancy at age 5 (e<sub>5</sub>) can be used to exclude the effects of infant mortality to reveal the effects of other causes of death. Typically, life expectancy at birth (e<sub>0</sub>) is specified. If the data on [[infant mortality rate]]s are suspect for some reason, such as the underreporting of births or of infant deaths, then life expectancy at age 1 (e<sub>1</sub>) or age 2 (e<sub>2</sub>) might also be used. |
||
| + | In the developed world there has been a considerable increas in life expecancy since the turn of the last century. For example in the UK in 1901 life expectancy for men was 45 and by 2008 it was 82 and for women it has gone up from 49 to 85{{Citation}}. So improved [[health care]], reduction in [[war]], good nutrition etc has lead to a doubling of life expectancy in that period. |
||
| − | ==Life expectancy over human history== |
||
| − | [[Image:Life expectancy 1950-2005.png|thumb|Life expectancy has been increasing and converging for most of the world. Sub-Saharan Africa has recently seen a decline, partly related to the [[HIV]] epidemic.]] |
||
| − | |||
| − | One of the biggest jumps in life expectancy coincided with the introduction of [[sewer]]s, which greatly reduced the spread of disease. In the last few centuries a strong statistical effect was caused by the near elimination of [[infant mortality]] in the [[Western world]] and elsewhere. |
||
| − | |||
| − | Average life expectancy before the 'health transition' of the modern era is thought to have varied between about 20 years and 35 years, depending upon particular circumstances. It has been suggested that life expectancy fell with the introduction of plant and animal domestication because of: |
||
| − | * higher [[infection]] rates caused by the increase in human settlement size and density, |
||
| − | * poorer nutrition due to low dietary variety.<ref>Galor, Oded and Moav, Omer, "Natural Selection and the Evolution of Life Expectancy" (October 12, 2005). Minerva Center for Economic Growth Paper No. 02-05 http://ssrn.com/abstract=563741</ref> |
||
| − | |||
| − | Life expectancy recovered somewhat in the [[Bronze Age]] but it is only in recent centuries (since 1800) that it has dramatically increased. These changes are the result of a combination of factors including nutrition and public health, and medicine only marginally. The most important single factor in the increase is the reduction in death in infancy. The greatest improvements have been made in the richest parts of the world. |
||
| − | |||
| − | Life expectancy increased dramatically in the [[20th century]], especially in developed nations. Life expectancy at birth in the [[United States]] in 1901 was 49 years. At the end of the century it was 77 years, an increase of 57%. Similar gains have been enjoyed throughout the world. Life expectancy in [[China]] was around 35 years at midcentury. At century's close it had risen to around 71 years. Life expectancy in India at midcentury was around 32, by 2000 it had risen to 64 years. These gains were due largely to the eradication and control of numerous infectious diseases and to advances in agricultural technology (such as [[chemical fertilizer]]s). |
||
| − | |||
| − | Basic life expectancy numbers tend to exaggerate this growth, however. The low level of pre-modern life expectancy is distorted by the previous extremely high [[infant mortality|infant]] and childhood mortality. If a person did make it to the age of forty they had an average of another twenty years to live. Improvements in medicine, public health, and nutrition have therefore mainly increased the numbers of people living beyond childhood, with less effect on overall average lifespan. |
||
| − | |||
| − | The major exception to this general pattern of improvement has been in those countries worst hit by [[AIDS]], principally in Sub-Saharan Africa, which have seen significant falls in life expectancy due to the disease in recent years. Another exception is [[Russia]] and some other former USSR republics after the [[collapse of the Soviet Union]]. Life expectancy of men dropped to 59.9 years (below the official [[retirement]] age), of women to 72.43 years (1999). |
||
| − | |||
| − | In recent years, [[obesity]]-related diseases have become a major public health issue in many countries. The prevalence of obesity is thought to have reduced the potential for longer life expectancy by contributing to the rise of cancers, heart disease and diabetes in the developed world. |
||
| − | |||
| − | Throughout human history most of the increase in life expectancy arose from preventing early deaths. However, many scientists believe this will not stay true in the near future as medical advancements aimed at better monitoring day to day, medically significant test values, and simple intervention such as blood pressure and clotting level control will prevent many sudden deaths or strokes. It is widely believed by researchers, that a full half of the North American and Japanese babies born since 2000 will live to an age of 90, and 10% to 100 years of age. It is hoped, with that extended lifespan, more productive and non-debilitated years will be added to the extreme upper end of middle age. |
||
| − | |||
| − | ==Timeline for humans== |
||
| − | |||
| − | ''Homo sapiens'' live on average 32.6 years in [[Swaziland]] and on average 81 years in Japan. The [[Jeanne Calment|oldest confirmed recorded age for any human]] is 122 years, though some people are reported to have lived longer. |
||
| − | The following information is derived from the ''Encyclopaedia Britannica'', 1961, as well as other sources: |
||
| − | |||
| − | {| border="1" cellspacing="0" |
||
| − | ! [[Homo (genus)|Homos]] by Era !! Average Lifespan<br>(years) !! Comment |
||
| − | |- |
||
| − | | [[Neanderthal]] || align="center" | 20 || ''Homo neanderthalensis'' may actually be different species from modern humans but is still in any case a member of the genus [[Homo (genus)|Homo]]. |
||
| − | |- |
||
| − | | [[Paleolithic|Upper Paleolithic]] || align="center" | 33 || 33 at birth; upon reaching age 15: 54<ref>Jason Godesky, "Thesis #25", http://anthropik.com/2006/01/thesis-25-civilization-reduces-quality-of-life/ (2005)</ref><ref>Hillard Kaplan, et. al, in "A Theory of Human Life History Evolution: Diet, Intelligence, and Longevity" (Evolutionary Anthropology, 2000, p. 156-185,http://media.anthropik.com/pdf/kaplan2000.pdf</ref><ref>Caspari & Lee 'Older age becomes common late in human evolution' (Proceedings of the National Academy of Sciences, USA, 2004, p. 10847-10848</ref> |
||
| − | |- |
||
| − | | [[Neolithic]] || align="center" | 20 || |
||
| − | |- |
||
| − | | [[Bronze Age]] || align="center" | 18<ref>James Trefil, "Can We Live Forever?" ''101 Things You Don't Know About Science and No One Else Does Either'' (1996)</ref> || |
||
| − | |- |
||
| − | | [[Classical Greece]] || align="center" | 28 || |
||
| − | |- |
||
| − | | [[Classical Rome]] || align="center" | 28 || |
||
| − | |- |
||
| − | | [[Medieval Britain]] || align="center" | 33 || |
||
| − | |- |
||
| − | | [[1800s|End of 19th Century Western Europe]] || align="center" | 37 || |
||
| − | |- |
||
| − | | [[2000s|Current world average]] || align="center" | 66 || <ref>World Bank - http://www.worldbank.org/depweb/english/modules/social/life/index.html</ref> |
||
| − | |- |
||
| − | | Present day "non-civilized"<br>native groups || align="center" | 34 || At birth: 34 At age 15: 54 At age 50: 67 <ref>Hillard Kaplan, et. al, in "A Theory of Human Life History Evolution: Diet, Intelligence, and Longevity" (Evolutionary Anthropology, 2000, p. 156-185,http://media.anthropik.com/pdf/kaplan2000.pdf</ref><ref>Jason Godesky, "Thesis #25", http://anthropik.com/2006/01/thesis-25-civilization-reduces-quality-of-life/ (2005)</ref> |
||
| − | |} |
||
| − | |||
| − | These represent the life expectancies of the population as a whole. In many instances life expectancy varied considerably according to class and gender. All statistics are slanted in that they include infant mortality, but do not include abortions. The sharp drop in life expectancy with the advent of the neolithic mirrors the evidence that the advent of agriculture, actually marked a sharp drop in life expectancy that humans are only recovering from in affluent nations today. |
||
==Variations in life expectancy in the world today== |
==Variations in life expectancy in the world today== |
||
| Line 107: | Line 57: | ||
==See also== |
==See also== |
||
| + | * [[Age discrimination]] |
||
| + | * [[Aging]] |
||
| + | * [[Demography]] |
||
| + | * [[Human development]] |
||
* [[Morbidity]] |
* [[Morbidity]] |
||
* [[Mortality]] |
* [[Mortality]] |
||
| − | * [[ |
+ | * [[Physiological aging]] |
| − | * [[Economics]] |
||
| − | * [[Indefinite lifespan]] |
||
| − | * [[List of countries by life expectancy]] |
||
| − | * [[Maximum life span]] |
||
* [[Senescence]] |
* [[Senescence]] |
||
| + | |||
===Increasing life expectancy=== |
===Increasing life expectancy=== |
||
| Line 138: | Line 89: | ||
* [http://www.cdc.gov/nchs/fastats/lifexpec.htm CDC year-by-year life expectancy figures for USA] from the USA Centers for Disease Controls and Prevention, National Center for Health Statistics. |
* [http://www.cdc.gov/nchs/fastats/lifexpec.htm CDC year-by-year life expectancy figures for USA] from the USA Centers for Disease Controls and Prevention, National Center for Health Statistics. |
||
* [http://www.worldpolicy.org/globalrights/econrights/maps-life.html Map of life expectancy around the world] from the World Policy Institute. |
* [http://www.worldpolicy.org/globalrights/econrights/maps-life.html Map of life expectancy around the world] from the World Policy Institute. |
||
| − | * [http://www.utexas.edu/depts/classics/documents/Life.html Life expectancy in Roman times] from the University of Texas. |
||
* [http://www.ac.wwu.edu/~stephan/Animation/expectancy.html The changing influence of sex and race on life expectancy in the US] from Western Washington University. |
* [http://www.ac.wwu.edu/~stephan/Animation/expectancy.html The changing influence of sex and race on life expectancy in the US] from Western Washington University. |
||
* [http://www.mortality.org Database of life expectancy from multiple countries] from The human Mortality Database. |
* [http://www.mortality.org Database of life expectancy from multiple countries] from The human Mortality Database. |
||
| Line 149: | Line 99: | ||
[[Category:Gerontology]] |
[[Category:Gerontology]] |
||
| + | <!-- |
||
| − | |||
| − | + | [[ca:Esperança de vida]] |
|
[[de:Lebenserwartung]] |
[[de:Lebenserwartung]] |
||
[[es:Esperanza de vida]] |
[[es:Esperanza de vida]] |
||
| Line 163: | Line 113: | ||
[[ru:Ожидаемая продолжительность жизни]] |
[[ru:Ожидаемая продолжительность жизни]] |
||
[[fi:Elinajanodote]] |
[[fi:Elinajanodote]] |
||
| + | --> |
||
{{enWP|Life expectancy}} |
{{enWP|Life expectancy}} |
||
Latest revision as of 14:17, 30 December 2009
Assessment |
Biopsychology |
Comparative |
Cognitive |
Developmental |
Language |
Individual differences |
Personality |
Philosophy |
Social |
Methods |
Statistics |
Clinical |
Educational |
Industrial |
Professional items |
World psychology |
Developmental Psychology: Cognitive development · Development of the self · Emotional development · Language development · Moral development · Perceptual development · Personality development · Psychosocial development · Social development · Developmental measures
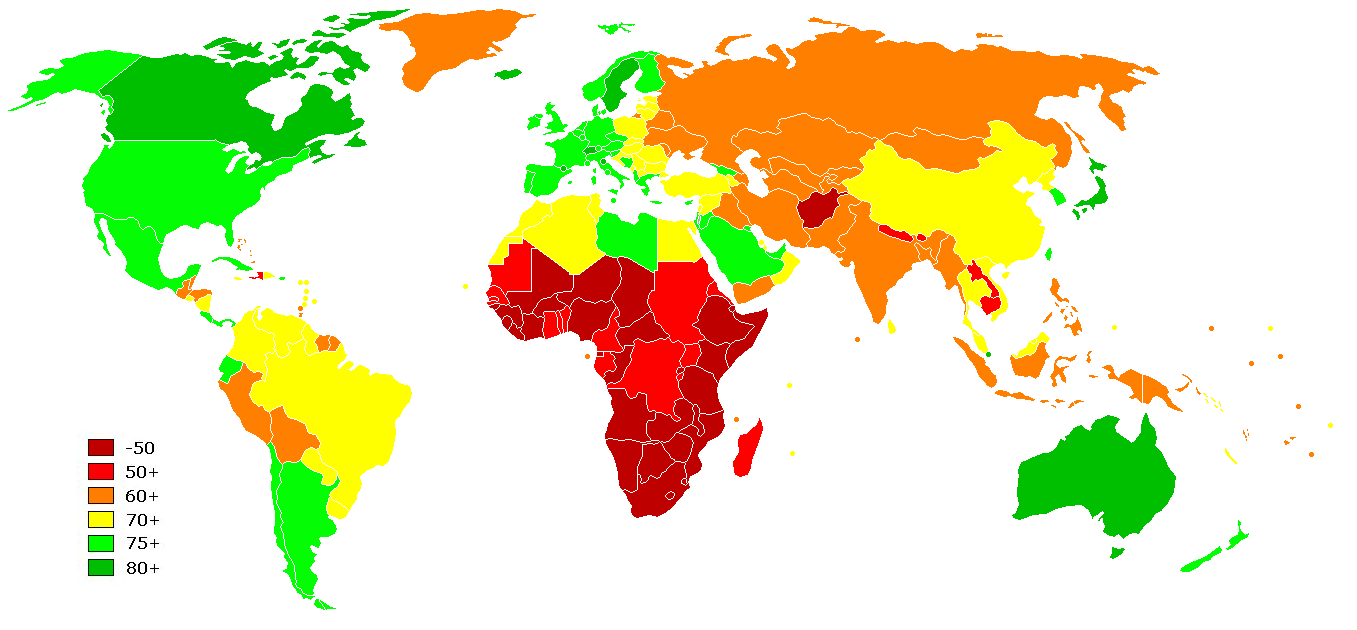
World map of life expectancy, 2005
Life expectancy is a statistical measure defined as the expected (mean) survival of human beings based upon a number of criteria such as gender and geographic location. Popularly, it is most often construed to mean the life expectancy at birth for a given human population, which is the same as the expected age at death. However, technically life expectancy means the expected number of years remaining to live, and it can be calculated for any age.
Life expectancy is heavily dependent on the criteria used to select the group. In countries with high infant mortality rates, the life expectancy at birth is highly sensitive to the rate of death in the first few years of life. In these cases, another measure such as life expectancy at age 5 (e5) can be used to exclude the effects of infant mortality to reveal the effects of other causes of death. Typically, life expectancy at birth (e0) is specified. If the data on infant mortality rates are suspect for some reason, such as the underreporting of births or of infant deaths, then life expectancy at age 1 (e1) or age 2 (e2) might also be used.
In the developed world there has been a considerable increas in life expecancy since the turn of the last century. For example in the UK in 1901 life expectancy for men was 45 and by 2008 it was 82 and for women it has gone up from 49 to 85. So improved health care, reduction in war, good nutrition etc has lead to a doubling of life expectancy in that period.
Variations in life expectancy in the world today
There are great variations in life expectancy worldwide, mostly caused by differences in public health, medicine and nutrition from country to country.
There are also variations between groups within single countries. For example, in the United States during the early 20th century there were large differences in life expectancy between people of different ethnicity, which have since lessened. Significant differences still remain in life expectancy between men and women in the US and other developed countries, with women outliving men. These gender differences have been lessening in recent years, with men's life expectancy improving at a faster rate than women's. Poverty has a very substantial effect on life expectancy. In the United Kingdom life expectancy in the wealthiest areas is ten years longer than the poorest areas and the gap appears to be increasing as life expectancy for the prosperous continues to increase while in more deprived communities there is little increase.[1]
Life expectancy may also be reduced for people exposed to high levels of highway air pollution[How to reference and link to summary or text] or industrial air pollution. Occupation may also have a major effect on life expectancy. Well-educated professionals working in offices have a high life expectancy, while coal miners (and in prior generations, asbestos cutters) do not. Other factors affecting an individual's life expectancy are genetic disorders, obesity, access to health care, diet, exercise, tobacco smoking, and excessive drug and alcohol use.
As pointed out above, AIDS has recently had a negative effect on life expectancy in Sub-Saharan Africa.
Evolution and aging rate
The different lifespans of different plants and animals, including humans raises the question of why such lifespans are found.
The evolutionary theory is that organisms that are able by virtue of their defenses or lifestyle to live for long periods whilst avoiding accidents, disease, predation etc. are likely to have genes that code for slow aging- good repair.
This is so because if a change to the organism (for example a bird might evolve stronger wings) may mean that it is exceptionally capable of escaping from predation, then it will live longer, and typically die of old age. It will also be more likely to survive to reproduce, so these genes will spread through the gene pool. Thus, a member of the population with the better wings who by chance also has genes that code for better repair will spend a longer time as its contemporaries in the best reproductive years and have more successors. Its genes will tend to dominate more and more of the gene pool and genes for slower aging and by a similar argument a slower reproduction rate, will dominate.
Conversely a change to the environment that means that organisms die younger from a common disease or a new threat from a predator will mean that organisms that have genes that code for putting more energy into reproduction than repair will do better.
The support for this theory includes the fact that better defended animals, for example small birds that can fly away from danger live for a decade or more whereas mice which cannot, die of old age in a year or two. Tortoises and turtles are very well defended indeed and can live for over a hundred years.
Calculating life expectancy
The starting point for calculating life expectancies is the age-specific death rates of the population members. For example, if 10% of a group of people alive at their 90th birthday die before their 91st birthday, then the age-specific death rate at age 90 would be 10%.
These values are then used to calculate a life table, from which one can calculate the probability of surviving to each age. In actuarial notation the probability of surviving from age x to age x+n is denoted and the probability of dying during age x (i.e. between ages x and x+1) is denoted .


The life expectancy at age x, denoted , is then calculated by adding up the probabilities to survive to every age. This is the expected number of complete years lived (one may think of it as the number of birthdays they celebrate).


Because age is rounded down to the last birthday, on average people live half a year beyond their final birthday, so half a year is added to the life expectancy to calculate the full life expectancy.
Life expectancy is by definition an arithmetic mean. It can be calculated also by integrating the survival curve from ages 0 to infinite (the ultimate age, sometimes called 'omega'). For an extinct cohort (all people born in year 1850, for example), of course, it can simply be calculated by averaging the ages at death.
Note that no allowance has been made in this calculation for expected changes in life expectancy in the future. Usually when life expectancy figures are quoted, they have been calculated like this with no allowance for expected future changes. This means that quoted life expectancy figures are not generally appropriate for calculating how long any given individual of a particular age is expected to live, as they effectively assume that current death rates will be "frozen" and not change in the future. Instead, life expectancy figures can be thought of as a useful statistic to summarize the current health status of a population. Some models do exist to account for the evolution of mortality (e.g., the Lee-Carter model[2]).
Interpreting life expectancy
Useful information can be gleaned from life expectancy at ages other than 0 as medical technology changes over time. For example, in the United States the life expectancy at birth over the past 100 years has increased by over 50%. However, the life expectancy for 60 year old persons has only increased 10%. This means that the improvements in medical technology have done much to decrease mortality among the young, but relatively little to help the elderly. In other words, although the odds of living to old age have increased, the maximum probable lifespan has not changed dramatically.
The age-adjusted statistics help to show the limits of health technology as well. It has been suggested that there is a maximum human life span of around 125 years -- not even by chance has anyone been documented to live longer than that. In other words, even if a person never dies of disease, accident or violence, we can expect them to die of "old age" by that time.
Typically, the expected age at death (i.e. age x + life expectancy at age x) of an individual of age X is greater than the life expectancy at birth for the population as a whole. For example, in a population with a life expectancy of 75 years, a 20-year-old might be expected to live to her or his mid-80s. But it is theoretically possible that there could be an inversion of life-expectancy between the old and the young if there were sufficiently dramatic medical advances. For example, some diseases such as shingles occur during old age, but are caused at a young age. If shingles were a leading cause of death, we could imagine that the chicken pox vaccine would so much increase their life expectancy, that they would likely out-live their elders. Another example would be where in some places like southern Africa the incidence of HIV is so high among the adult population, that a new, effective and widely-distributed vaccine might increase life expectancy of a Lesotho 11-year old (who would benefit from the vaccine and never get HIV disease) to be higher than the life expectancy of a Lesotho 21-year old (who might have a 50% chance of dying soon of AIDS and cannot be helped by the vaccine)..
See also
- Age discrimination
- Aging
- Demography
- Human development
- Morbidity
- Mortality
- Physiological aging
- Senescence
Increasing life expectancy
- Engineered negligible senescence
- John Sperling
- Life extension
- Longevity
- Rejuvenation
References
- ↑ Department of Health -Tackling health inequalities: Status report on the Programme for Action
- ↑ Ronald D. Lee and Lawrence Carter. 1992. "Modeling and Forecasting the Time Series of U.S. Mortality," Journal of the American Statistical Association 87 (September): 659-671.
Further reading
- Leonid A. Gavrilov & Natalia S. Gavrilova (1991), The Biology of Life Span: A Quantitative Approach. New York: Harwood Academic Publisher, ISBN 3-7186-4983-7
External links
- Rank Order - Life expectancy at birth from the CIA's World Factbook.
- CDC year-by-year life expectancy figures for USA from the USA Centers for Disease Controls and Prevention, National Center for Health Statistics.
- Map of life expectancy around the world from the World Policy Institute.
- The changing influence of sex and race on life expectancy in the US from Western Washington University.
- Database of life expectancy from multiple countries from The human Mortality Database.
- Animal lifespans: Animal Lifespans from Tesarta Online,The Life Span of Animals from Dr Bob's All Creatures Site.
| This page uses Creative Commons Licensed content from Wikipedia (view authors). |