(Created page with '{{SocPsy}} thumb|right|200px|[[CIA World Factbook 2008 figures of total [[Real versus nominal value (economics)|nom…') |
|||
| Line 330: | Line 330: | ||
{{DEFAULTSORT:Gross Domestic Product}} |
{{DEFAULTSORT:Gross Domestic Product}} |
||
| − | [[Category: |
+ | [[Category:Economics]] |
| − | [[Category:Index numbers]] |
||
[[Category:Gross Domestic Product]] |
[[Category:Gross Domestic Product]] |
||
| + | <!-- |
||
[[af:Bruto binnelandse produk]] |
[[af:Bruto binnelandse produk]] |
||
[[ar:ناتج محلي إجمالي]] |
[[ar:ناتج محلي إجمالي]] |
||
Latest revision as of 18:10, 7 January 2010
Assessment |
Biopsychology |
Comparative |
Cognitive |
Developmental |
Language |
Individual differences |
Personality |
Philosophy |
Social |
Methods |
Statistics |
Clinical |
Educational |
Industrial |
Professional items |
World psychology |
Social psychology: Altruism · Attribution · Attitudes · Conformity · Discrimination · Groups · Interpersonal relations · Obedience · Prejudice · Norms · Perception · Index · Outline
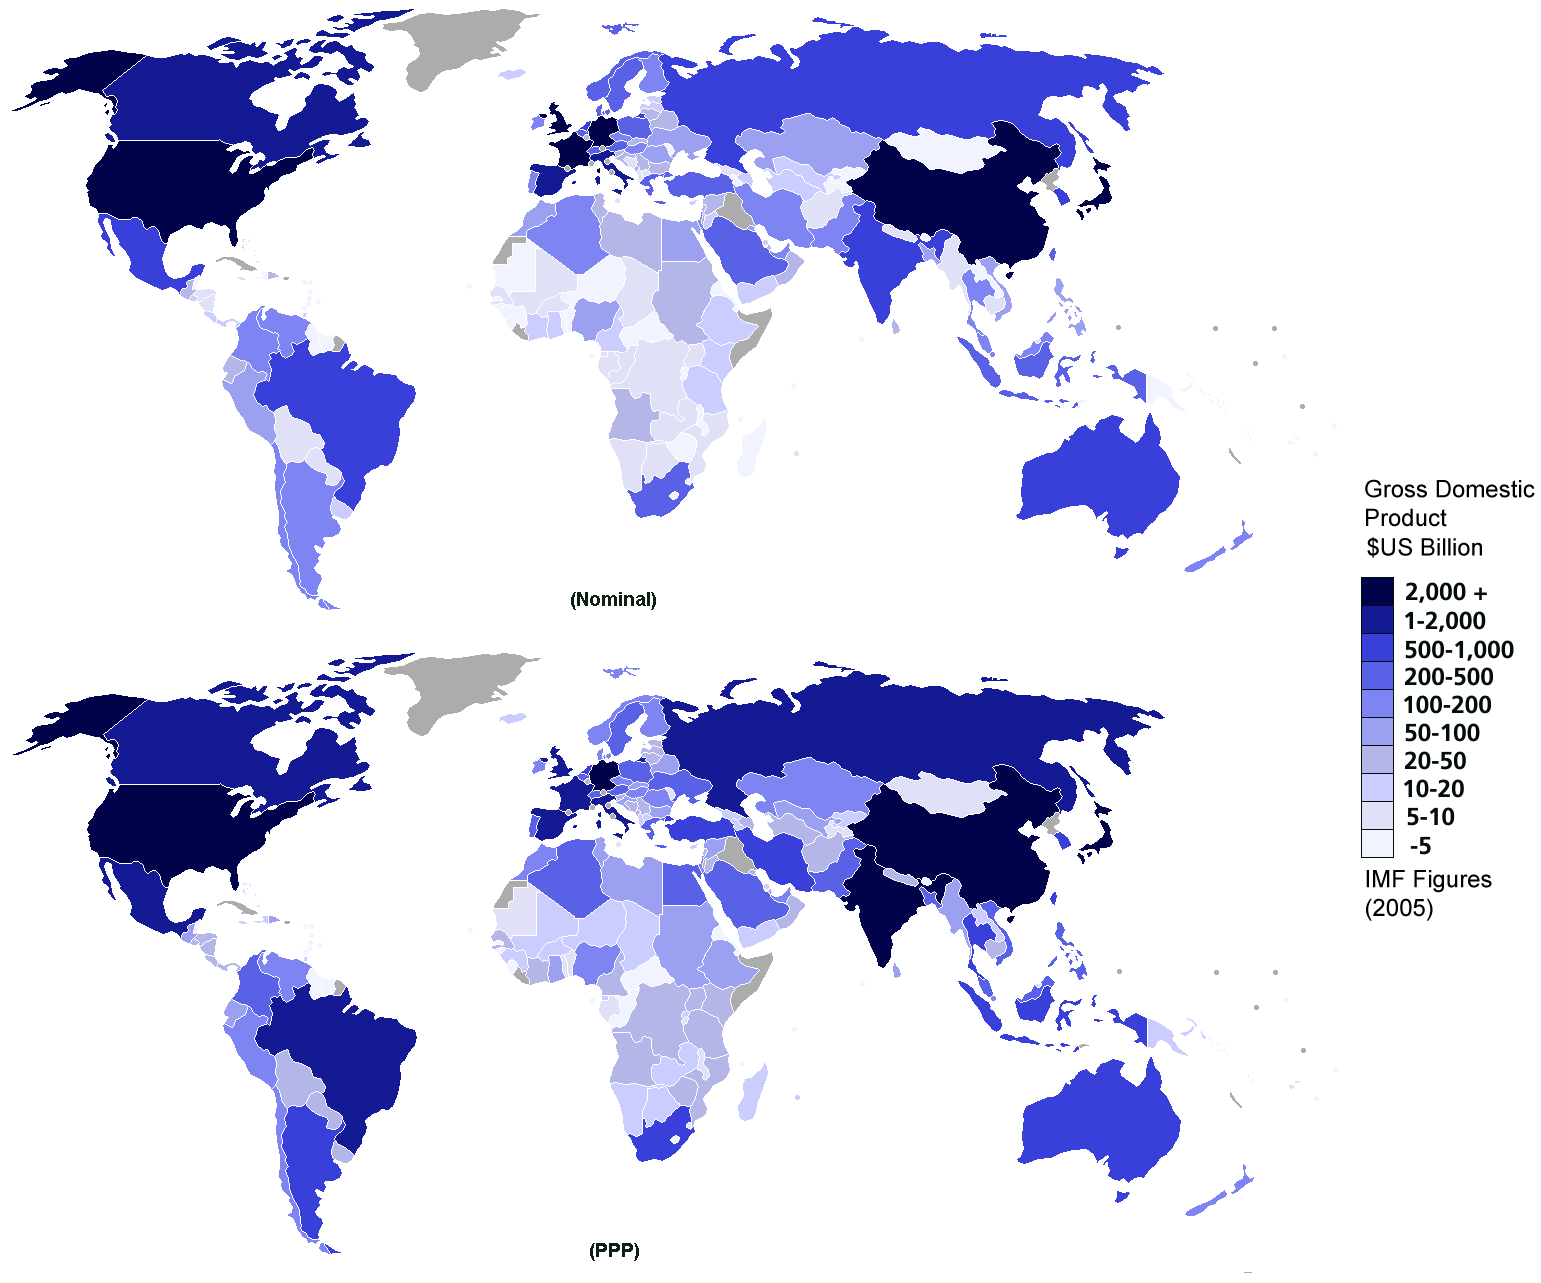
CIA World Factbook 2008 figures of total nominal GDP (bottom) compared to PPP-adjusted GDP (top)

Countries by 2008 GDP (nominal) per capita (IMF, October 2008 estimate)

GDP (PPP) per capita
The gross domestic product (GDP) or gross domestic income (GDI) is a basic measure of a country's overall economic output. It is the market value of all final goods and services made within the borders of a country in a year. It is often positively correlated with the standard of living,[1] though its use as a stand-in for measuring the standard of living has come under increasing criticism and many countries are actively exploring alternative measures to GDP for that purpose.[2] GDP can be determined in three ways, all of which should in principle give the same result. They are the product (or output) approach, the income approach, and the expenditure approach. The most direct of the three is the product approach, which sums the outputs of every class of enterprise to arrive at the total. The expenditure approach works on the principle that all of the product must be bought by somebody, therefore the value of the total product must be equal to people's total expenditures in buying things. The income approach works on the principle that the incomes of the productive factors ("producers," colloquially) must be equal to the value of their product, and determines GDP by finding the sum of all producers' incomes.[3]
Example: the expenditure method:
- GDP = private consumption + gross investment + government spending + (exports − imports), or

In the name "Gross Domestic Product,"
"Gross" means that GDP measures production regardless of the various uses to which that production can be put. Production can be used for immediate consumption, for investment in new fixed assets or inventories, or for replacing depreciated fixed assets. If depreciation of fixed assets is subtracted from GDP, the result is called the Net domestic product; it is a measure of how much product is available for consumption or adding to the nation's wealth. In the above formula for GDP by the expenditure method, if net investment (which is gross investment minus depreciation) is substituted for gross investment, then net domestic product is obtained.
"Domestic" means that GDP measures production that takes place within the country's borders. In the expenditure-method equation given above, the exports-minus-imports term is necessary in order to null out expenditures on things not produced in the country (imports) and add in things produced but not sold in the country (exports).
Economists (since Keynes) have preferred to split the general consumption term into two parts; private consumption, and public sector (or government) spending. Two advantages of dividing total consumption this way in theoretical macroeconomics are:
- Private consumption is a central concern of welfare economics. The private investment and trade portions of the economy are ultimately directed (in mainstream economic models) to increases in long-term private consumption.
- If separated from endogenous private consumption, government consumption can be treated as exogenous,[citation needed] so that different government spending levels can be considered within a meaningful macroeconomic framework.
Gross domestic product comes under the heading of national accounts, which is a subject in macroeconomics. Economic measurement is called econometrics.
Determining GDP
Template:Economics sidebar
Product approach
Usually in this approach the economy is broken down into classes of enterprise: agriculture, construction, manufacturing, etc. Their outputs are estimated largely on the basis of surveys which businesses fill out. To avoid "double-counting" in cases where the output of one enterprise is not a final good, but serves as input into another enterprise, either only final goods outputs must be counted, or a "value-added" approach must be taken, where what is counted is not the total value output by an enterprise, but its value-added: the difference between the value of its output and the value of its input.
- Gross Value Added = Sum of values added by all enterprises = Sales of goods - purchase of intermediate goods to produce the goods sold
Depending on how gross value added has been calculated, it may be necessary to make an adjustment to it before it can be considered equal to GDP. This is because GDP is the market value of goods and services – the price paid by the customer – but the price received by the producer may be different than this if the government taxes or subsidises the product. For example, if there is a sales tax:
- Producer's price + sales tax = market price
If taxes and subsidies have not already been computed as part of GVA, we must compute GDP as:
- GDP = GVA + Taxes on products - Subsidies on products
Expenditure method
In contemporary economies, most things produced are produced for sale, and sold. Therefore, measuring the total expenditure of money used to buy things is a way of measuring production. This is known as the expenditure method of calculating GDP. Note that if you knit yourself a sweater, it is production but does not get counted as GDP because it is never sold. Sweater-knitting is a small part of the economy, but if one counts some major activities such as child-rearing (generally unpaid) as production, GDP ceases to be an accurate indicator of production.
Components of GDP by expenditure
GDP (Y) is a sum of Consumption (C), Investment (I), Government Spending (G) and Net Exports (X - M).
- Y = C + I + G + (X − M)
Here is a description of each GDP component:
- C (consumption) is normally the largest GDP component, consisting of private household expenditures in the economy. These personal expenditures fall under one of the following categories: durable goods, non-durable goods, and services. Examples include food, rent, jewelry, gasoline, and medical expenses but does not include the purchase of new housing.
- I (investment) includes business investment in plant, equipment, inventory, and structures, and does not include exchanges of existing assets. Examples include construction of a new mine, purchase of software, or purchase of machinery and equipment for a factory. Spending by households (not government) on new houses is also included in Investment. In contrast to its colloquial meaning, 'Investment' in GDP does not mean purchases of financial products. Buying financial products is classed as 'saving', as opposed to investment. This avoids double-counting: if one buys shares in a company, and the company uses the money received to buy plant, equipment, etc., the amount will be counted toward GDP when the company spends the money on those things; to also count it when one gives it to the company would be to count two times an amount that only corresponds to one group of products. Buying bonds or stocks is a swapping of deeds, a transfer of claims on future production, not directly an expenditure on products.
- G (government spending) is the sum of government expenditures on final goods and services. It includes salaries of public servants, purchase of weapons for the military, and any investment expenditure by a government. It does not include any transfer payments, such as social security or unemployment benefits.
- X (exports) represents gross exports. GDP captures the amount a country produces, including goods and services produced for other nations' consumption, therefore exports are added.
- M (imports) represents gross imports. Imports are subtracted since imported goods will be included in the terms G, I, or C, and must be deducted to avoid counting foreign supply as domestic.
Note that C, G, and I are expenditures on final goods and services; expenditures on intermediate goods and services do not count. (Intermediate goods and services are those used by businesses to produce other goods and services within the accounting year.[5] )
According to the U.S. Bureau of Economic Analysis, which is responsible for calculating the national accounts in the United States, :In general, the source data for the expenditures components are considered more reliable than those for the income components [see income method, below]."[6]
Examples of GDP component variables
C, I, G, and NX(net exports): If a person spends money to renovate a hotel to increase occupancy rates, the spending represents private investment, but if he buys shares in a consortium to execute the renovation, it is saving. The former is included when measuring GDP (in I), the latter is not. However, when the consortium conducted its own expenditure on renovation, that expenditure would be included in GDP.
If a hotel is a private home, spending for renovation would be measured as consumption, but if a government agency converts the hotel into an office for civil servants, the spending would be included in the public sector spending, or G.
If the renovation involves the purchase of a chandelier from abroad, that spending would be counted as C, G, or I (depending on whether a private individual, the government, or a business is doing the renovation), but then counted again as an import and subtracted from the GDP so that GDP counts only goods produced within the country.
If a domestic producer is paid to make the chandelier for a foreign hotel, the payment would not be counted as C, G, or I, but would be counted as an export.
GDP real growth rates for 2008
Income method
Another way of measuring GDP is to measure total income. If GDP is calculated this way it is sometimes called Gross Domestic Income (GDI), or GDP(I). GDI should provide the same amount as the expenditure method described above. (By definition, GDI = GDP. In practice, however, measurement errors will make the two figures slightly off when reported by national statistical agencies.)
Total income can be subdivided according to various schemes, leading to various formulae for GDP measured by the income approach. A common one is:
- GDP = compensation of employees + gross operating surplus + gross mixed income + taxes less subsidies on production and imports
- GDP = COE + GOS + GMI + TP & M - SP & M
- Compensation of employees (COE) measures the total renumeration to employees for work done. It includes wages and salaries, as well as employer contributions to social security and other such programs.
- Gross operating surplus (GOS) is the surplus due to owners of incorporated businesses. Often called profits, although only a subset of total costs are subtracted from gross output to calculate GOS.
- Gross mixed income (GMI) is the same measure as GOS, but for unincorporated businesses. This often includes most small businesses.
The sum of COE, GOS and GMI is called total factor income; it is the income of all of the factors of production in society. It measures the value of GDP at factor (basic) prices. The difference between basic prices and final prices (those used in the expenditure calculation) is the total taxes and subsidies that the government has levied or paid on that production. So adding taxes less subsidies on production and imports converts GDP at factor cost to GDP(I).
Total factor income is also sometimes expressed as:
- Total factor income = Employee compensation + Corporate profits + Proprieter's income + Rental income + Net interest[7]
Yet another formula for GDP by the income method is:[citation needed]

where R : rents
I : interests
P : profits
SA : statistical adjustments (corporate income taxes, dividends, undistributed corporate profits)
W : wages
Note the mnemonic, "ripsaw".
The production boundary
Not all useful human activity is counted in GDP. Indeed, not everything that economists recognise as "production" is counted in GDP. The economists who compile GDP readily admit even the latter point. However, it raises several questions: What does GDP actually measure? Is it a useful figure? Does it mean what most people think it means?
The economists who compile national accounts speak of a "production boundary" that delimits what will be counted as GDP.
"One of the fundamental questions that must be addressed in preparing the national economic accounts is how to define the production boundary – that is, what parts of the myriad human activities are to be included in or excluded from the measure of the economic production."[8]
All output for market is at least in theory included within the boundary. Market output is defined as that which is sold for "economically significant" prices; economically significant prices are "prices which have a significant influence on the amounts producers are willing to supply and purchasers wish to buy."[9] An exception is that illegal goods and services are often excluded even if they are sold at economically significant prices (Australia and the United States exclude them).
This leaves non-market output. It is partly excluded and partly included. First, "natural processes without human involvment or direction" are excluded.[10] Also, there must be a person or institution that owns or is entitled to compensation for the product. An example of what is included and excluded by these criteria is given by the United States' national accounts agency: "the growth of trees in an uncultivated forest is not included in production, but the harvesting of the trees from that forest is included."[11]
Within the limits so far described, the boundary is further constricted by "functional considerations."[12] The Australian Bureau for Statistics explains this: "The national accounts are primarily constructed to assist governments and others to make market-based macroeconomic policy decisions, including analysis of markets and factors affecting market performance, such as inflation and unemployment." Consequently, production that is, according to them, "relatively independent and isolated from markets," or "difficult to value in an economically meaningful way" [ie., difficult to put a price on] is excluded.[13] Thus excluded are services provided by people to members of their own families free of charge, such as child rearing, meal preparation, cleaning, transportation, entertainment of family members, emotional support, care of the elderly.[14] Most other production for own (or one's family's) use is also excluided, with two notable exceptions which are given in the list later in this section.
Nonmarket outputs that are included within the boundary are listed below. Since, by definition, they do not have a market price, the complilers of GDP must impute a value to them, usually either the cost of the goods and services used to produce them, or the value of a similar item that is sold on the market.
- Goods and services provided by governments and non-profit organisations free of charge or for economically insignficant prices are included. The value of these goods and services is estimated as equal to their cost of production.[15]
- Goods and services produced for own-use by businesses are attempted to be included. An example of this kind of production would be a machine constructed by an engineering firm for use in its own plant.
- Renovations and upkeep by an individual to a home that she owns and occupies are included. The value of the upkeep is estimated as the rent that she could charge for the home if she did not occupy it herself. This is the largest item of production for own use by an individual (as opposed to a business) that the compilers include in GDP.[16]
- Agricultural production for consumption by oneself or one's household is included.
- Services (such as chequeing-account maintenance and services to borrowers) provided by banks and other financial institutions without charge or for a fee that does not reflect their full value have a value imputed to them by the compilers and are included. The financial institutions provide these services by giving the customer a less advantageous interest rate than they would if the services were absent; the value imputed to these services by the compilers is the difference between the interest rate of the account with the services and the interest rate of a similar account that does not have the services. According to the United States Bureau for Economic Analysis, this is one of the largest imputed items in the GDP.[17]
GDP vs GNP
GDP can be contrasted with gross national product (GNP) or gross national income (GNI). The difference is that GDP defines its scope according to location, while GNP defines its scope according to ownership. GDP is product produced within a country's borders; GNP is product produced by enterprises owned by a country's citizens. The two would be the same if all of the productive enterprises in a country were owned by its own citizens, but foreign ownership makes GDP and GNP non-identical. Production within a country's borders, but by an enterprise owned by somebody outside the country, counts as part of its GDP but not its GNP; on the other hand, production by an enterprise located outside the country, but owned by one of its citizens, counts as part of its GNP but not its GDP.
To take the United States as an example, the U.S.'s GNP is the value of output produced by American-owned firms, regardless of where the firms are located.
Gross national income (GNI) equals GDI plus income receipts from the rest of the world minus income payments to the rest of the world.
In 1991, the United States switched from using GNP to using GDP as its primary measure of production.[18] The relationship between United States GDP and GNP is shown in table 1.7.5 of the National Income and Product Accounts [1].
Year-over-year real GNP growth in the United States in 2007 was 3.2%.
International standards
The international standard for measuring GDP is contained in the book System of National Accounts (1993), which was prepared by representatives of the International Monetary Fund, European Union, Organization for Economic Co-operation and Development, United Nations and World Bank. The publication is normally referred to as SNA93 to distinguish it from the previous edition published in 1968 (called SNA68) [citation needed] Template:Why.
SNA93 provides a set of rules and procedures for the measurement of national accounts. The standards are designed to be flexible, to allow for differences in local statistical needs and conditions.
Template:Expand section
National measurement
Within each country GDP is normally measured by a national government statistical agency, as private sector organizations normally do not have access to the information required (especially information on expenditure and production by governments).
- Main article: National agencies responsible for GDP measurement
Interest rates
Net interest expense is a transfer payment in all sectors except the financial sector. Net interest expenses in the financial sector are seen as production and value added and are added to GDP.
Adjustments to GDP
When comparing GDP figures from one year to another, it is desirable to compensate for changes in the value of money – inflation or deflation. The raw GDP figure as given by the equations above is called the nominal, or historical, or current, GDP. To make it more meaningful for year-to-year comparisons, it may be multiplied by the ratio between the value of money in the year the GDP was measured and the value of money in some base year. For example, suppose a country's GDP in 1990 was $100 million and its GDP in 2000 was $300 million; but suppose that inflation had halved the value of its currency over that period. To meaningfully compare its 2000 GDP to its 1990 GDP we could multiply the 2000 GDP by one-half, to make it relative to 1990 as a base year. The result would be that the 2000 GDP equals $300 million x one-half = $150 million, in 1990 monetary terms. We would see that the country's GDP had, realistically, increased by 1.5 times over that period, not 3 times, as it might appear from the raw GDP data. The GDP adjusted for changes in money-value in this way is called the real, or constant, GDP.
The factor used to convert GDP from current to constant values in this way is called the GDP deflator. Unlike the Consumer price index, which measures inflation (or deflation – rarely!) in the price of household consumer goods, the GDP deflator measures changes in the prices all domestically produced goods and services in an economy – including investment goods and government services, as well as household consumption goods.[19]
Constant-GDP figures allow us to calculate a GDP growth rate, which tells us how much a country's production has increased (or decreased, if the growth rate is negative) compared to the previous year.
- Real GDP growth rate for year n = [(Real GDP in year n) - (Real GDP in year n - 1)]/ (Real GDP in year n - 1)
Another thing that it may be desirable to compensate for is population growth. If a country's GDP doubled over some period but its population tripled, the increase in GDP may not be deemed such a great accomplishment: the average person in the country is producing less than they were before. Per-capita GDP is the measure compensated for population growth.
Cross-border comparison
The level of GDP in different countries may be compared by converting their value in national currency according to either the current currency exchange rate, or the purchase power parity exchange rate.
- Current currency exchange rate is the exchange rate in the international currency market.
- Purchasing power parity exchange rate is the exchange rate based on the purchasing power parity (PPP) of a currency relative to a selected standard (usually the United States dollar).
The ranking of countries may differ significantly based on which method is used.
- The current exchange rate method converts the value of goods and services using global currency exchange rates. The method can offer better indications of a country's international purchasing power and relative economic strength. For instance, if 10% of GDP is being spent on buying hi-tech foreign arms, the number of weapons purchased is entirely governed by current exchange rates, since arms are a traded product bought on the international market. There is no meaningful 'local' price distinct from the international price for high technology goods.
- The purchasing power parity method accounts for the relative effective domestic purchasing power of the average producer or consumer within an economy. The method can provide a better indicator of the living standards of less developed countries, because it compensates for the weakness of local currencies in the international markets. For example, India ranks 12th by nominal GDP, but fourth by PPP. The PPP method of GDP conversion is more relevant to non-traded goods and services.
There is a clear pattern of the purchasing power parity method decreasing the disparity in GDP between high and low income (GDP) countries, as compared to the current exchange rate method. This finding is called the Penn effect.
For more information, see Measures of national income and output.
Standard of living and GDP
GDP per capita is not a measurement of the standard of living in an economy. However, it is often used as such an indicator, on the rationale that all citizens would benefit from their country's increased economic production. Similarly, GDP per capita is not a measure of personal income. GDP may increase while incomes for the majority of a country's citizens may even decrease or change disproportionally. For example, in the US from 1990 to 2006 the earnings (adjusted for inflation) of individual workers, in private industry and services, increased by less than 0.5% per year while GDP (adjusted for inflation) increased about 3.6% per year over the same period.[20]
The major advantage of GDP per capita as an indicator of standard of living is that it is measured frequently, widely and consistently. It is measured frequently in that most countries provide information on GDP on a quarterly basis, which allows a user to spot trends regularly. It is measured widely in that some measure of GDP is available for almost every country in the world, allowing comparisons to be made between countries. It is measured consistently in that the technical definition of GDP is relatively consistent among countries.
The major disadvantage is that it is not, strictly speaking, a measure of standard of living. GDP is intended to be a measure of particular types of economic activity within a particular country. Nothing about the definition of GDP suggests it is necessarily a measure of standard of living. For instance, in an extreme example, a country which exported 100 per cent of its production and imported nothing would still have a high GDP, but a very poor standard of living.
The argument in favor of using GDP is not that it is a good indicator of the standard of living, but that, all other things being equal, the standard of living tends to increase when GDP per capita increases. As such, GDP can be a proxy for the standard of living, rather than a direct measure. The sometimes use of GDP per capita as a proxy of labor productivity is also problemmatic.
Limitations of GDP to judge the health of an economy
GDP is widely used by economists to gauge the health of an economy, as its variations are relatively quickly identified. However, its value as an indicator for the standard of living is considered to be limited. Not only that, but if the aim of economic activity is to produce ecologically sustainable increases in the overall human standard of living, GDP is a perverse measurement; it treats loss of ecosystem services as a benefit instead of a cost. Other criticisms of how the GDP is used include:
- Wealth distribution – GDP does not take disparity in incomes between the rich and poor into account. However, numerous Nobel-prize winning economists have disputed the importance of income inequality as a factor in improving long-term economic growth. In fact, short term increases in income inequality may even lead to long term decreases in income inequality. See income inequality metrics for discussion of a variety of inequality-based economic measures.
- Non-market transactions – GDP excludes activities that are not provided through the market, such as household production and volunteer or unpaid services. As a result, GDP is understated. Unpaid work conducted on Free and Open Source Software (such as Linux) contribute nothing to GDP, but it was estimated that it would have cost more than a billion US dollars for a commercial company to develop. Also, if Free and Open Source Software became identical to its proprietary software counterparts, and the nation producing the propriety software stops buying proprietary software and switches to Free and Open Source Software, then the GDP of this nation would reduce, however there would be no reduction in economic production or standard of living. The work of New Zealand economist Marilyn Waring has highlighted that if a concerted attempt to factor in unpaid work were made, then it would in part undo the injustices of unpaid (and in some cases, slave) labour, and also provide the political transparency and accountability necessary for democracy. Shedding some doubt on this claim, however, is the theory that won economist Douglass North the Nobel Prize in 1993. North argued that the creation and strengthening of the patent system, by encouraging private invention and enterprise, became the fundamental catalyst behind the Industrial Revolution in England.
- Underground economy – Official GDP estimates may not take into account the underground economy, in which transactions contributing to production, such as illegal trade and tax-avoiding activities, are unreported, causing GDP to be underestimated.
- Non-monetary economy – GDP omits economies where no money comes into play at all, resulting in inaccurate or abnormally low GDP figures. For example, in countries with major business transactions occurring informally, portions of local economy are not easily registered. Bartering may be more prominent than the use of money, even extending to services (I helped you build your house ten years ago, so now you help me).
- GDP also ignores subsistence production.
- Quality of goods – People may buy cheap, low-durability goods over and over again, or they may buy high-durability goods less often. It is possible that the monetary value of the items sold in the first case is higher than that in the second case, in which case a higher GDP is simply the result of greater inefficiency and waste.
- Quality improvements and inclusion of new products – By not adjusting for quality improvements and new products, GDP understates true economic growth. For instance, although computers today are less expensive and more powerful than computers from the past, GDP treats them as the same products by only accounting for the monetary value. The introduction of new products is also difficult to measure accurately and is not reflected in GDP despite the fact that it may increase the standard of living. For example, even the richest person from 1900 could not purchase standard products, such as antibiotics and cell phones, that an average consumer can buy today, since such modern conveniences did not exist back then.
- What is being produced – GDP counts work that produces no net change or that results from repairing harm. For example, rebuilding after a natural disaster or war may produce a considerable amount of economic activity and thus boost GDP. The economic value of health care is another classic example—it may raise GDP if many people are sick and they are receiving expensive treatment, but it is not a desirable situation. Alternative economic measures, such as the standard of living or discretionary income per capita better measure the human utility of economic activity. See uneconomic growth.
- Externalities – GDP ignores externalities or economic bads such as damage to the environment. By counting goods which increase utility but not deducting bads or accounting for the negative effects of higher production, such as more pollution, GDP is overstating economic welfare. The Genuine Progress Indicator is thus proposed by ecological economists and green economists as a substitute for GDP. In countries highly dependent on resource extraction or with high ecological footprints the disparities between GDP and GPI can be very large, indicating ecological overshoot. Some environmental costs, such as cleaning up oil spills are included in GDP.
- Sustainability of growth – GDP does not measure the sustainability of growth. A country may achieve a temporarily high GDP by over-exploiting natural resources or by misallocating investment. For example, the large deposits of phosphates gave the people of Nauru one of the highest per capita incomes on earth, but since 1989 their standard of living has declined sharply as the supply has run out. Oil-rich states can sustain high GDPs without industrializing, but this high level would no longer be sustainable if the oil runs out. Economies experiencing an economic bubble, such as a housing bubble or stock bubble, or a low private-saving rate tend to appear to grow faster owing to higher consumption, mortgaging their futures for present growth. Economic growth at the expense of environmental degradation can end up costing dearly to clean up; GDP does not account for this.
- One main problem in estimating GDP growth over time is that the purchasing power of money varies in different proportion for different goods, so when the GDP figure is deflated over time, GDP growth can vary greatly depending on the basket of goods used and the relative proportions used to deflate the GDP figure. For example, in the past 80 years the GDP per capita of the United States if measured by purchasing power of potatoes, did not grow significantly. But if it is measured by the purchasing power of eggs, it grew several times. For this reason, economists comparing multiple countries usually use a varied basket of goods.
- Cross-border comparisons of GDP can be inaccurate as they do not take into account local differences in the quality of goods, even when adjusted for purchasing power parity. This type of adjustment to an exchange rate is controversial because of the difficulties of finding comparable baskets of goods to compare purchasing power across countries. For instance, people in country A may consume the same number of locally produced apples as in country B, but apples in country A are of a more tasty variety. This difference in material well being will not show up in GDP statistics. This is especially true for goods that are not traded globally, such as housing.
- Transfer pricing on cross-border trades between associated companies may distort import and export measures[citation needed].
- As a measure of actual sale prices, GDP does not capture the economic surplus between the price paid and subjective value received, and can therefore underestimate aggregate utility.
- Austrian economist critique – Criticisms of GDP figures were expressed by Austrian economist Frank Shostak.[21] Among other criticisms, he stated the following:
He goes on:The GDP framework cannot tell us whether final goods and services that were produced during a particular period of time are a reflection of real wealth expansion, or a reflection of capital consumption.
Austrian economists are critical of the basic idea of attempting to quantify national output. Shostak quotes Austrian economist Ludwig von Mises:For instance, if a government embarks on the building of a pyramid, which adds absolutely nothing to the well-being of individuals, the GDP framework will regard this as economic growth. In reality, however, the building of the pyramid will divert real funding from wealth-generating activities, thereby stifling the production of wealth.
The attempt to determine in money the wealth of a nation or the whole mankind are as childish as the mystic efforts to solve the riddles of the universe by worrying about the dimension of the pyramid of Cheops.
Simon Kuznets in his very first report to the US Congress in 1934 said:[22]
...the welfare of a nation [can] scarcely be inferred from a measure of national income...
In 1962, Kuznets stated:[23]
Distinctions must be kept in mind between quantity and quality of growth, between costs and returns, and between the short and long run. Goals for more growth should specify more growth of what and for what.
Alternatives to GDP
- Human development index (HDI) - HDI uses GDP as a part of its calculation and then factors in indicators of life expectancy and education levels.
- Genuine progress indicator (GPI) or Index of Sustainable Economic Welfare (ISEW) - The GPI and the ISEW attempt to address many of the above criticisms by taking the same raw information supplied for GDP and then adjust for income distribution, add for the value of household and volunteer work, and subtract for crime and pollution.
- Gini coefficient - The Gini coefficient measures the disparity of income within a nation.
- Wealth estimates - The World Bank has developed a system for combining monetary wealth with intangible wealth (institutions and human capital) and environmental capital.[24]
- Private Product Remaining - Murray Newton Rothbard and other Austrian economists argue that because government spending is taken from productive sectors and produces goods that consumers do not want, it is a burden on the economy and thus should be deducted. In his book, America's Great Depression, Rothbard argues that even government surpluses from taxation should be deducted to create an estimate of PPR.
Some people have looked beyond standard of living at a broader sense of quality of life or well-being:
- European Quality of Life Survey - The survey, first published in 2005, assessed quality of life across European countries through a series of questions on overall subjective life satisfaction, satisfaction with different aspects of life, and sets of questions used to calculate deficits of time, loving, being and having.[25]
- Gross national happiness - The Centre for Bhutanese Studies in Bhutan is working on a complex set of subjective and objective indicators to measure 'national happiness' in various domains (living standards, health, education, eco-system diversity and resilience, cultural vitality and diversity, time use and balance, good governance, community vitality and psychological well-being). This set of indicators would be used to assess progress towards gross national happiness, which they have already identified as being the nation's priority, above GDP.
- Happy Planet Index - The happy planet index (HPI) is an index of human well-being and environmental impact, introduced by the New Economics Foundation (NEF) in 2006. It measures the environmental efficiency with which human well-being is achieved within a given country or group. Human well-being is defined in terms of subjective life satisfaction and life expectancy while environmental impact is defined by the Ecological Footprint.
Lists of countries by their GDP
- Lists of countries by GDP
- List of countries by GDP (nominal), (per capita)
- List of countries by GDP (PPP), (per capita), (per hour)
- List of countries by GDP growth
- List of countries by GDP (real) growth rate, (per capita)
- List of countries by GDP sector composition
- List of countries by future GDP estimates (PPP), (per capita), (nominal)
- List of countries by past GDP (PPP), (nominal)
See also
|
|
|
Bibliography
Australian Bureau for Statistics, Australian National Accounts: Concepts, Sources and Mathods, 2000. Retrieved November 2009. In depth explanations of how GDP and other national accounts items are determined.
United States Department of Commerce, Bureau of Economic Analysis, Concepts and Methods of the United States National Income and Product AccountsPDF. Retrieved November 2009. In depth explanations of how GDP and other national accounts items are determined.
References
- ↑ Sullivan, Arthur; Steven M. Sheffrin (1996). Economics: Principles in action, 57, 305, Upper Saddle River, New Jersey 074589: Pearson Prentice Hall.
- ↑ French President seeks alternatives to GDP, The Guardian 14-09-2009.
European Parliament, Policy Department Economic and Scientific Policy: Beyond GDP StudyPDF - ↑ World Bank, Statistical Manual >> National Accounts >> GDP – final output, retrieved October 2009.
User's guide: Background information on GDP and GDP deflator. HM Treasury.
Measuring the Economy: A Primer on GDP and the National Income and Product Accounts. (PDF) Bureau of Economic Analysis. - ↑ This calculation can be seen in United Kingdom, Annual Abstract of StatisticsPDF, 2008, p 254, Table 16.2 "gross domestic product and national income, current prices," near the top of the table. The United States appears to already include taxes minus subsidies in GVA, and thus equate it directly to GDP (BEA, Concepts and Methods of the National Income and Product Accounts of the United States, section 2-9).
- ↑ Thayer Watkins, San José State University Department of Economics, "Gross Domestic Product from the Transactions Table for an Economy", commentary to first table, " Transactions Table for an Economy". (Page retrieved November 2009.)
- ↑ Concepts and Methods of the United States National Income and Product Accounts, chap. 2.
- ↑ United States Bureau of Economic Analysis, A guide to the National Income and Product Accounts of the United StatesPDF, page 5; retrieved November 2009. Another term, "business current transfer payments," may be added. Also, the document indicates that Capital Consumption Adjustment (CCAdj) and Inventory Valuation Adjustment (IVA) are applied to the proprieter's income and corporate profits terms; and CCAdj is applied to rental income.
- ↑ BEA, Concepts and Methods of the United States National Income and Product Accounts, p 12.
- ↑ Australian National Accounts: Concepts, Sources and Methods, 2000, sections 3.5 and 4.15.
- ↑ This and the following statement on entitlement to compensation are from Australian National Accounts: Concepts, Sources and Methods, 2000, section 4.6.
- ↑ Concepts and Methods of the United States National Income and Product Accounts, page 2-2.
- ↑ Concepts and Methods of the United States National Income and Product Accounts, page 2-2.
- ↑ Australian National Accounts: Concepts, Sources and Methods, 2000, section 4.4.
- ↑ Concepts and Methods of the United States National Income and Product Accounts, page 2-2; and Australian National Accounts: Concepts, Sources and Methods, 2000, section 4.4.
- ↑ Concepts and Methods of the United States National Income and Product Accounts, page 2-4.
- ↑ Concepts and Methods of the United States National Income and Product Accounts, page 2-4.
- ↑ Concepts and Methods of the United States National Income and Product Accounts, page 2-5.
- ↑ United States, Bureau of Economic Analysis, Glossary, "GDP", retrieved November 2009.
- ↑ HM Treasury, Background information on GDP and GDP deflator
Some of the complications involved in comparing national accounts from different years are suggested in this World Bank document. - ↑ Statistical Abstract of the United States 2008. Tables 623 and 647
- ↑ http://mises.org/story/770
- ↑ Simon Kuznets, 1934. "National Income, 1929-1932". 73rd US Congress, 2d session, Senate document no. 124, page 7. http://library.bea.gov/u?/SOD,888
- ↑ Simon Kuznets. "How To Judge Quality". The New Republic, October 20, 1962
- ↑ World Bank wealth estimates.
- ↑ First European Quality of Life Survey.
External links
Global
- World GDP Chart (since 1960)
- Australian Bureau of Statistics Manual on GDP measurement
- GDP-indexed bonds
- GDP scaled maps
- Euro area GDP growth rate (since 1996) as compared to the Bank Rate (since 2000)
- World Development Indicators (WDI)
- Economist Country Briefings
- UN Statistical Databases
Data
- Bureau of Economic Analysis: Official United States GDP data
- Graphs of Historical Real U.S. GDP
- Historicalstatistics.org: Links to historical statistics on GDP for different countries and regions
- Complete listing of countries by GDP: Current Exchange Rate Method Purchasing Power Parity Method
- Historical US GDP (yearly data), 1790 - present
- Historical US GDP (quarterly data), 1947 - present
- OECD Statistics
Articles and books
- What's wrong with the GDP?
- Limitations of GDP Statistics by Schenk, Robert.
- whether output and CPI inflation are mismeasured, by Nouriel Roubini and David Backus, in Lectures in Macroeconomics
- "Measurement of the Aggregate Economy", chapter 22 of Dr. Roger A. McCain's Essential Principles of Economics: A Hypermedia Text
- Rodney Edvinsson, Growth, Accumulation, Crisis: With New Macroeconomic Data for Sweden 1800-2000PDF
- Clifford Cobb, Ted Halstead and Jonathan Rowe. "If the GDP is up, why is America down?" The Atlantic Monthly, vol. 276, no. 4, October 1995, pages 59–78.
Economic classification of countries | |||||||||
|---|---|---|---|---|---|---|---|---|---|
|
Developed country · Developing country · Least developed country · High income country · Newly-industrialized country | |||||||||
| Worlds Theory |
First World · Second World · Third World · Fourth World | ||||||||
| Lists of countries |
| ||||||||
| This page uses Creative Commons Licensed content from Wikipedia (view authors). |