Assessment |
Biopsychology |
Comparative |
Cognitive |
Developmental |
Language |
Individual differences |
Personality |
Philosophy |
Social |
Methods |
Statistics |
Clinical |
Educational |
Industrial |
Professional items |
World psychology |
Clinical: Approaches · Group therapy · Techniques · Types of problem · Areas of specialism · Taxonomies · Therapeutic issues · Modes of delivery · Model translation project · Personal experiences ·
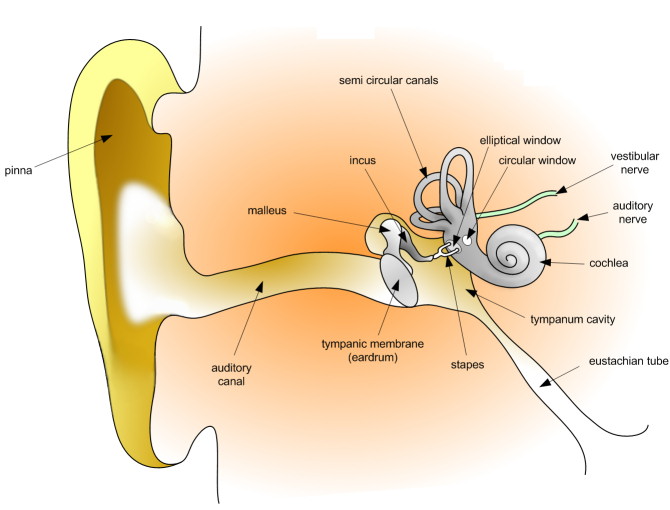
Diagram of the human ear
Pure tone audiometry (PTA) is the key hearing test used to identify hearing threshold levels of an individual, enabling determination of the degree, type and configuration of a hearing loss. Thus, providing the basis for diagnosis and management. PTA is a subjective, behavioural measurement of hearing threshold, as it relies on patient response to pure tone stimuli. Therefore, PTA is used on adults and children old enough to cooperate with the test procedure. As with most clinical tests, calibration of the test environment, the equipment and the stimuli to ISO standards is needed before testing proceeds. PTA only measures thresholds, rather than other aspects of hearing such as sound localization. However, there are benefits of using PTA over other forms of hearing test, such as click auditory brainstem response. PTA provides ear specific thresholds, and uses frequency specific pure tones to give place specific responses, so that the configuration of a hearing loss can be identified. As PTA uses both air and bone conduction audiometry, the type of loss can also be identified via the air-bone gap. Although PTA has many clinical benefits, it is not perfect at identifying all losses, such as ‘dead regions’[1]. This raises the question of whether or not audiograms accurately predict someone’s perceived degree of disability.
PTA procedural standards[]
There are both international and British standards regarding the PTA test protocol. The British Society of Audiology (BSA) is responsible for publishing the recommended procedure for PTA, as well as many other audiological procedures. The British recommended procedure is based on international standards. Although there are some differences, the BSA recommended procedures are in accordance with BS EN ISO 8253-1, which are the international standards for PTA, by the International Organization for Standardization. The BSA recommended procedures give a best practice test protocol for professionals to follow, increasing the validity and allowing standardisation of results across Britain[2].
Variations of pure tone audiometry[]
There are cases where conventional PTA is not an appropriate or effective method of threshold testing. Procedural changes to the conventional test method may be necessary with populations who are unable to cooperate with the test, in order to obtain hearing thresholds. Sound field audiometry may be more suitable where patients are unable to wear earphones, as the stimuli is usually presented by loudspeaker. The disadvantage of this method is that although thresholds can be obtained, it is not ear specific. Also, response to pure tone stimuli may be limited. This is because in a sound field they create standing waves, which alter sound intensity within the sound field. Therefore, it may be necessary to use other stimuli, such as warble tones in sound field testing[3]. There are variations of conventional audiometry testing that are designed specifically for young children and infants, such as visual reinforcement audiometry and play audiometry[4].
Conventional audiometry tests frequencies lie in between 250 Hertz(Hz) and 8 kHz. Whereas, high frequency audiometry tests in the region of 8-20 kHz. The effects of ototoxic medication and noise exposure for example, appear to be more detrimental to the high frequencies, than mid or low frequencies. Therefore, high frequency audiometry is an effective method of monitoring losses that are suspected to have been caused by these factors. It is also effective in detecting the auditory sensitivity changes which occur with aging[5].
Cross hearing and interaural attenuation[]

Figure 1: Interaural attenuation with air conduction.

Figure 2: Interaural attenuation with bone conduction
When sound is applied to one ear the contralateral cochlea can also be stimulated to varying degrees, via vibrations through the bone of the skull. When the stimuli presented to the test ear stimulates the cochlea of the non-test ear, this is known as cross hearing. Whenever it is suspected that cross hearing has occurred it is best to use masking. This is done by temporarily elevating the threshold of the non-test ear, by presenting a masking noise at a predetermined level. This prevents the non-test ear from detecting the test signal presented to the test ear. The threshold of the test ear is measured at the same time as presenting the masking noise to the non-test ear. Thus, thresholds obtained when masking has been applied, provide an accurate representation of the true hearing threshold level of the test ear[2][6].
A reduction or loss of energy occurs with cross hearing, which is referred to as interaural attenuation (IA) or transcranial transmission loss[6]. IA varies with transducer type. It varies from 40dB to 80dB with supra-aural headphones. However, with insert earphones it is in the region of 55dB[2]. The use of insert earphones reduces the need for masking, due to the greater IA which occurs when they are used (See Figure 1)[7].
Air conduction results in isolation, give little information regarding the type of hearing loss. When the thresholds obtained via air conduction are examined alongside those achieved with bone conduction, the configuration of the hearing loss can be determined. However, with bone conduction (performed by placing a vibrator on the mastoid bone behind the ear), both cochlear are stimulated. IA for bone conduction ranges from 0-20dB (See Figure 2).Therefore, conventional audiometry is ear specific, with regards to both air and bone conduction audiometry, when masking is applied[2].
The cochlea - The role of the outer and inner hair cells[]

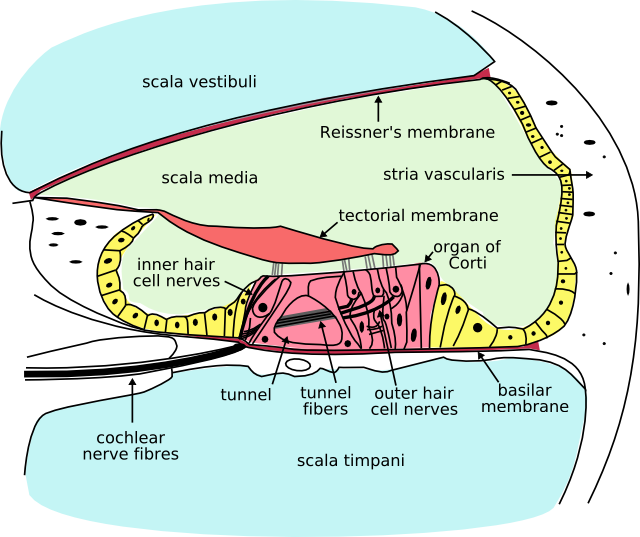
Figure 3: Cross-section of the cochlea.
Outer hair cells (OHCs) contribute to the structure of the Organ of Corti, which is situated between the basilar membrane and the tectorial membrane within the cochlea (See Figure 3). The tunnel of corti, which runs through the Organ of Corti, divides the OHCs and the inner hair cells (IHCs). OHCs are connected to the reticular laminar and the Deiters’ cells. There are roughly twelve thousand OHCs in each human ear, and these are arranged in up to five rows. Each OHC has small tufts of hairs on their upper surface known as stereocilia, and these are also arranged into rows which are graded in height. There are approximately 140 stereocilia on each OHC[8].
The fundamental role of the OHCs and the IHCs is to function as sensory receptors. The main function of the IHCs is to transmit sound information via afferent neurons. They do this by transducing mechanical movements or signals into neural activity. When stimulated, the stereocilia on the IHCs move, causing a flow of electrical current to pass through the hair cells. This electrical current creates action potentials within the connected afferent neurons.
OHCs are different in that they actually contribute to the active mechanism of the cochlea. They do this by receiving mechanical signals or vibrations along the basilar membrane, and transducing them into electrochemical signals. The stereocilia found on OHCs are in contact with the tectorial membrane. Therefore, when the basilar membrane moves due to vibrations, the stereocilia bend. The direction in which they bend, dictates the firing rate of the auditory neurons connected to the OHCs[9].
The bending of the stereocilia towards the basal body of the OHC causes excitation of the hair cell. Thus, an increase in firing rate of the auditory neurons connected to the hair cell occurs. On the other hand, the bending of the stereocilia away from the basal body of the OHC causes inhibition of the hair cell. Thus, a decrease in firing rate of the auditory neurons connected to the hair cell occurs. OHCs are unique in that they are able to contract and expand (electromotility). Therefore, in response to the electrical stimulations provided by the efferent nerve supply, they can alter in length, shape and stiffness. These changes influence the response of the basilar membrane to sound[8][9]. It is therefore clear that the OHCs play a major role in the active processes of the cochlea[8]. The main function of the active mechanism is to finely tune the basilar membrane, and provide it with a high sensitivity to quiet sounds. The active mechanism is dependent on the cochlea being in good physiological condition. However, the cochlea is very susceptible to damage[9].
Cochlea hearing loss[]
Cochlea hearing loss is also known as sensorineural hearing loss (SNHL), and is most prevalent in the elderly. In this situation, the hearing loss is acquired through the ageing process, and is referred to as presbyacusis. SNHL is most commonly caused by damage to the OHCs and the IHCs. There are two methods by which they might become damaged. Firstly, the entire hair cell might die. Secondly, the stereocilia might become distorted or destroyed. Damage to the cochlea can occur in several ways, for example by viral infection, exposure to ototoxic chemicals, and intense noise exposure. Damage to the OHCs results in either a less effective active mechanism, or it may not function at all. OHCs contribute to providing a high sensitivity to quiet sounds at a specific range of frequencies (approximately 2-4 kHz). Thus, damage to the OHCs results in the reduction of sensitivity of the basilar membrane to weak sounds. Amplification to these sounds is therefore required, in order for the basilar membrane to respond efficiently. IHCs are less susceptible to damage in comparison to the OHCs. However, if they become damaged, this will result in an overall loss of sensitivity[9].
Frequency selectivity and neural tuning curves[]

Figure 4: Neural tuning curve for normal hearing. Adapted from [9].
The traveling wave along the basilar membrane peaks at different places along it, depending on whether the sound is low or high frequency. Due to the mass and stiffness of the basilar membrane, low frequency waves peak in the apex, while high frequency sounds peak in the basal end of the cochlea[8]. Therefore, each position along the basilar membrane is finely tuned to a particular frequency. These specifically tuned frequencies are referred to as characteristic frequencies (CF)[9].
If a sound entering the ear is displaced from the characteristic frequency, then the strength of response from the basilar membrane will progressively lessen. The fine tuning of the basilar membrane is created by the input of two separate mechanisms. The first mechanism being a linear passive mechanism, which is dependent on the mechanical structure of the basilar membrane and its surrounding structures. The second mechanism is a non-linear active mechanism, which is primarily dependent on the functioning of the OHCs, and also the general physiological condition of the cochlea itself. The base and apex of the basilar membrane differ in stiffness and width, which cause the basilar membrane to respond differently to varying frequencies along its length. The base of the basilar membrane is narrow and stiff, resulting in it responding best to high frequency sounds. The apex of the basilar membrane is wider and much less stiff in comparison to the base, causing it to respond best to low frequencies[9].
This selectivity to certain frequencies can be illustrated by neural tuning curves. These demonstrate the frequencies a fiber responds to, by showing threshold levels (dB SPL) of auditory nerve fibers as a function of different frequencies. This demonstrates that auditory nerve fibers respond best, and hence have better thresholds at the fibers characteristic frequency and frequencies immediately surrounding it. The basilar membrane is said to be ‘sharply tuned’ due to the sharp ‘V’ shaped curve, with its ‘tip’ centered at the auditory fibers characteristic frequency. This shape shows how few frequencies a fiber responds to. If it were a broader ‘V’ shape, it would be responding to more frequencies (See Figure 4)[8].
The effect of cochlea hearing loss on neural tuning curves[]

Figure 5: Neural tuning curve for OHC loss. Adapted from [9].

Figure 6: Neural tuning curve for OHC front row loss and IHC loss. Adapted from [9].
A normal neural tuning curve is characterised by a broadly tuned low frequency ‘tail’, with a finely tuned middle frequency ‘tip’. However, where there is partial or complete damage to the OHCs, but with unharmed IHCs, the resulting tuning curve would show the elimination of sensitivity at the quiet sounds. I.e. where the neural tuning curve would normally be most sensitive (at the ‘tip’) (See Figure 5)[9].
Where both the OHCs and the IHCs are damaged, the resulting neural tuning curve would show the elimination of sensitivity at the ‘tip'. However, due to IHC damage, the whole tuning curve becomes raised, giving a loss of sensitivity across all frequencies (See Figure 6). It is only necessary for the first row of OHCs to be damaged for the elimination of the finely tuned ‘tip’ to occur. This supports the idea that the incidence of OHC damage and thus a loss of sensitivity to quiet sounds, occurs more than IHC loss[9].
Dead regions and their effect on audiometric results[]
When the IHCs of part of the basilar membrane are damaged or destroyed, so that they no longer function as transducers, the result is a ‘dead region’. Dead regions can be defined in terms of the characteristic frequencies of the IHC, related to the specific place along the basilar membrane where the dead region occurs. Assuming that there has been no shift in the characteristic frequencies relating to certain regions of the basilar membrane, due to the damage of OHCs. This often occurs with IHC damage. Dead regions can also be defined by the anatomical place of the non-functioning IHC (such as an “apical dead region”), or by the characteristic frequencies of the IHC adjacent to the dead region[1].
Dead regions affect audiometric results, but perhaps not in the way expected. For example, it may be expected that thresholds would not be obtained at the frequencies within the dead region, but would be obtained at frequencies adjacent to the dead region. Therefore, assuming normal hearing exists around the dead region, it would produce an audiogram that has a dramatically steep slope between the frequency where a threshold is obtained, and the frequency where a threshold cannot be obtained due to the dead region[1].


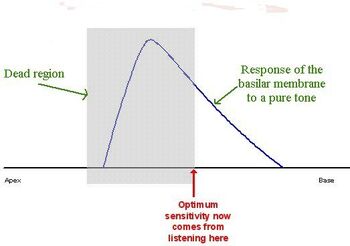
Figure 7: Response of the basilar membrane to a pure tone.

Figure 8: Response of the basilar membrane to a pure tone, when there is a dead region.
However, it appears that this is not the case. Dead regions cannot be clearly found via PTA audiograms. This may be because although the neurons innervating the dead region, cannot react to vibration at their characteristic frequency. If the basilar membrane vibration is large enough, neurons tuned to different characteristic frequencies such as those adjacent to the dead region, will be stimulated due to the spread of excitation. Therefore, a response from the patient at the test frequency will be obtained. This is referred to as “off-place listening”, and is also known as ‘off-frequency listening’. This will lead to a false threshold being found. Thus, it appears a person has better hearing than they actually do, resulting in a dead region being missed. Therefore, using PTA alone, it is impossible to identify the extent of a dead region (See Figure 7 and 8)[1].
Consequently, how much is an audiometric threshold affected by a tone with its frequency within a dead region? This depends on the location of the dead region. Thresholds at low frequency dead regions, are more inaccurate than those at higher frequency dead regions. This has been attributed to the fact that excitation due to vibration of the basilar membrane spreads upwards from the apical regions of the basilar membrane, more than excitation spreads downwards from higher frequency basal regions of the cochlea. This pattern of the spread of excitation is similar to the ‘upward spread of masking’ phenomenon. If the tone is sufficiently loud to produce enough excitation at the normally functioning area of the cochlea, so that it is above that areas threshold. The tone will be detected, due to off-frequency listening which results in a misleading threshold[1].
To help to overcome the issue of PTA producing inaccurate thresholds within dead regions, masking of the area beyond the dead region that is being stimulated can be used. This means that the threshold of the responding area is sufficiently raised, so that it cannot detect the spread of excitation from the tone. This technique has led to the suggestion that a low frequency dead region may be related to a loss of 40-50 dB[10][11]. However, as one of the aims of PTA is to determine whether or not there is a dead region, its may be difficult to assess which frequencies to mask without the use of other tests[1].
Based on research it has been suggested that a low frequency dead region may produce a relatively flat loss, or a very gradually sloping loss towards the higher frequencies. As the dead region will be less detectable due to the upward spread of excitation. Whereas, there may be a more obvious steeply sloping loss at high frequencies for a high frequency dead region. Although it is likely that the slope represents the less pronounced downward spread of excitation, rather than accurate thresholds for those frequencies with non-functioning hair cells. Mid-frequency dead regions, with a small range, appear to have less effect on the patient’s ability to hear in everyday life, and may produce a notch in the PTA thresholds[1].
Alternative methods to identify a dead region: Psychoacoustic tuning curves[]

Figure 9: Pyschoacoustical tuning curve.
Although some debate continues regarding the reliability of such tests[12], it has been suggested that psychoacoustic tuning curves (PTCs) and threshold-equalising noise (TEN) results may be useful in detecting dead regions, rather than PTA. PTCs are similar to neural tuning curves. They illustrate the level of a masker (dB SPL) tone at threshold, as a function of deviation from center frequency (Hz)[8]. They are measured by presenting a fixed low intensity pure tone while also presenting a narrow-band masker, with a varying center frequency. The masker level is varied, so that the level of masker needed to just mask the test signal is found for the masker at each center frequency. The tip of the PTC is where the masker level needed to just mask the test signal is the lowest. For normal hearing people this is when the masker center frequency is closest to the frequency of the test signal (See Figure 9)[13].
In the case of dead regions, when the test signal lies within the boundaries of a dead region, the tip of the PTC will be shifted to the edge of the dead region, to the area that is still functioning and detecting the spread of excitation from the signal. In the case of a low frequency dead region, the tip is shifted upwards indicating a low frequency dead region starting at the tip of the curve. For a high frequency dead region, the tip is shifted downwards from the signal frequency to the functioning area below the dead region[13]. However, the traditional method of obtaining PTCs is not practical for clinical use, and it has been argued that TEN’s are not accurate enough[12][13]. A fast method for finding PTCs has been developed and it may provide the solution. However, more research to validate this method is required, before it can be accepted clinically. Although it is clear that PTA is not the best test to identify a dead region[13].
Perceptual consequences of a dead region- Do audiograms help to predict this?[]
Audiogram configurations are not good indicators of how a dead region will affect a person functionally, mainly due to individual differences[9]. For example, a sloping audiogram is often present with someone with a dead region, due to the spread of excitation. However, the individual may well be affected differently from someone with a corresponding sloped audiogram, caused by partial damage to hair cells rather than a dead region. They will perceive sounds differently, yet the audiogram suggests that they have the same degree of loss. Huss and Moore investigated how hearing impaired patients perceive pure tones, and found that they perceive tones as noisy and distorted, more (on average) than a person without a hearing impairment. However, they also found that the perception of tones as being like noise, was not directly related to frequencies within the dead regions, and was therefore not an indicator of a dead region. This therefore suggests that audiograms, and their poor representation of dead regions, are inaccurate predictors of a patient’s perception of pure tone quality[14].
Research by Kluk and Moore has shown that dead regions may also affect the patient’s perception of frequencies beyond the dead regions. There is an enhancement in the ability to distinguish between tones that differ very slightly in frequency, in regions just beyond the dead regions compared to tones further away. An explanation for this may be that cortical re-mapping has occurred. Whereby, neurons which would normally be stimulated by the dead region, have been reassigned to respond to functioning areas near it. This leads to an over-representation of these areas, resulting in an increased perceptual sensitivity to small frequency differences in tones. Therefore, PTA audiograms may not represent the individuals perception of their hearing loss[15].
How well do thresholds obtained using PTA correlate with hearing disability?[]
PTA is described as the gold standard for assessment of a hearing loss[16]. But, how accurate is PTA at classifying the hearing loss of an individual, in terms of hearing impairment and hearing disability? Hearing impairment is defined by the World Health Organisation (WHO) as a hearing loss in one or both ears. The degree of hearing loss is classified as mild, moderate, severe or profound[17]. The results of PTA are a good indicator of hearing impairment.
Hearing disability is defined by the WHO as a reduction in ability to hear sounds in quiet and background noise (compared to people with normal hearing), which is caused by a hearing impairment[18]. Several studies have investigated whether self-reported hearing problems (via questionnaires and interviews) were associated with the results from PTA. The findings of these studies indicate that in general, the results of PTA correspond to self-reported hearing problems (i.e. hearing disability). However, for some individuals this is not the case. Therefore, the results of PTA cannot be used to ascertain an individuals hearing disability[19][20][21].


Figure 10: Speech recognition threshold (SRT) in noise. To aid explanation of this concept the CHL and the SNHL have the same magnitude of hearing loss (50 dBHL). The horizontal part of the curves is where the noise is inaudible. Thus, there is no masking effect on the SRT. The horizontal portion of the curve for the SNHL and CHL extends further than that for a normal hearing person, as the noise needs to become audible to become a problem. Thus, more noise has to be applied, to produce a masking effect. At the right hand side of the graph, to identify 50% of the speech correctly, the speech needs to much more intense than in the quiet. This is because at this end of the graph, the noise is very loud whether the person has a hearing loss or not. There is a transition between these two areas described. Factor A is a problem only in low noise levels, whereas Factor D is a problem when the noise level is high.
Hearing impairment (based on the audiogram) and auditory handicap (based on speech discrimination in noise) data was reviewed by Reinier Plomp. This led to the formulation of equations, which described the consequences of a hearing loss on speech intelligibility. The results of this review indicated that there were two factors of a hearing loss, which were involved in the effect on speech intelligibility. These factors were named Factor A and Factor D. Factor A affected speech intelligibility by attenuating the speech, whereas Factor D affected speech intelligibility by distorting the speech[21].
Speech recognition threshold (SRT) is defined as the sound pressure level at which 50% of the speech is identified correctly. For a person with a conductive hearing loss (CHL) in quiet, the SRT needs to be higher than for a person with normal hearing. The increase in SRT depends on the degree of hearing loss only, so Factor A reflects the audiogram of that person. In noise, the person with a CHL has the same problem as the person with normal hearing (See Figure 10)[21].
For a person with a SNHL in quiet, the SRT also needs to be higher than for a person with normal hearing. This is because the only factor that is important in quiet for a CHL and a SNHL is the audibility of the sound, which corresponds to Factor A. In noise, the person with a SNHL requires a better signal-to-noise ratio to achieve the same performance level, as the person with normal hearing and the person with a CHL. This shows that in noise, Factor A is not enough to explain the problems of a person with a SNHL. Therefore, there is another problem present, which is Factor D. At present, it is not known what causes Factor D. Thus, in noise the audiogram is irrelevant. It is the type of hearing loss that is important in this situation[21].
These findings have important implications for the design of hearing aids. As hearing aids at present can compensate for Factor A, but this is not the case for Factor D. This could be why hearing aids are not satisfactory for a lot of people[21].
See also[]
- Audiograms in mammals
- Auditory masking
- Auditory filters
- Absolute threshold of hearing
- Equal-loudness contours
- Otoacoustic emission
- Prestin
References[]
- ↑ 1.0 1.1 1.2 1.3 1.4 1.5 1.6 Moore BCJ. Dead Regions in the Cochlea: Diagnosis, Perceptual Consequences, and Implications for the Fitting of hearing aids. Trends Amplif. 2001;5:1-34.
- ↑ 2.0 2.1 2.2 2.3 The British Society of Audiology. Recommended Procedure: Pure Tone air and bone conduction threshold audiometry with and without masking and determination of uncomfortable loudness levels. The British Society of Audiology. March 2004. http://www.thebsa.org.uk/docs/bsapta.doc [Accessed 15/02/07].
- ↑ http://www.emedicine.com/ent/topic311.htm [Accessed on 27/02/07].
- ↑ http://www.ndcs.org.uk/family_support/education_and_health/health/understanding_deafness/#faqblock9 [Accessed on 03/03/07].
- ↑ Monteiro de Castro Silva I, Feitosa MA. High frequency audiometry in young and older adults when conventional audiometry is normal. Rev Bras Otorrinolaringol. 2006;72:665-72.
- ↑ 6.0 6.1 Katz J. Clinical Handbook of Audiology. 5th ed. Philadelphia: Lippincott Williams & Wilkins; 2002.
- ↑ Bagatto M, Moodie S, Scollie S, Seewald R, Moodie S, Pumford J. Clinical protocols for hearing instrument fitting in the Desired Sensation level method. Trends Amplif. 2005;9:199-226.
- ↑ 8.0 8.1 8.2 8.3 8.4 8.5 Gelfand SA. Hearing: An Introduction to Psychological and Physiological Acoustics. 4th ed. New York: Marcel Dekker; 2004.
- ↑ 9.00 9.01 9.02 9.03 9.04 9.05 9.06 9.07 9.08 9.09 9.10 9.11 Moore BCJ. Cochlear Hearing Loss. London: Whurr Publishers; 1998.
- ↑ Terkildsen K. Hearing impairment and audiograms. Scand Audiol. 1980;10 Suppl:27-31. Cited in: Moore, BC. Dead Regions in the Cochlea: Diagnosis, Perceptual Consequences, and Implications for the Fitting of hearing aids. Trends Amplif. 2001;5:1-34.
- ↑ Thornton AR, Abbas PJ. Low-frequency hearing loss: Perception of filtered speech, psychophysical tuning curves, and masking. J Acoust Soc Am. 1980;67:638-43. Cited in: Moore, BC. Dead Regions in the Cochlea: Diagnosis, Perceptual Consequences, and Implications for the Fitting of hearing aids. Trends Amplif. 2001;5:1-34.
- ↑ 12.0 12.1 Summers V, Molis MR, Musch H, Walden BE, Surr RK, Cord, MT. Identifying Dead Regions in the Cochlea: Psychophysical Tuning Curves and Tone Detection in Threshold-Equalizing Noise. Ear Hear. 2003;24:133-42.
- ↑ 13.0 13.1 13.2 13.3 Sek A, Alcantara J, Moore BC, Kluk K, Wicher A. Development of a fast method for determining psychophysical tuning curves. Int J Audiol. 2005;44:408-20.
- ↑ Huss M, Moore BCJ. Dead Regions and noisiness of pure tones. Int J Audiol 2005;44:599-611.
- ↑ Kluk K, Moore BC. Dead regions and enhancement of frequency discrimination: Effects of audiogram slope, unilateral versus bilateral loss, and hearing-aid use. Hear. Res. 2006;222:1-15.
- ↑ Sindhusake D, Mitchell P, Smith W, Golding M, Newall P, Hartley D, et al. Validation of self-reported hearing loss. The Blue Mountains Hearing Study. Int. J. Epidemiol. 2001;30:1371-78.
- ↑ http://www.who.int/mediacentre/factsheets/fs300/en/index.html [Accessed 12/03/07].
- ↑ http://www.dohc.ie/publications/pdf/hearing.pdf?direct=1 [Accessed 12/03/07].
- ↑ Hietamen A, Era P, Henrichsen J, Rosenhall U, Sorri M, Heikkinen E. Hearing among 75-year old people in three Nordic localities: A comparative study. Int. J. Audiol. 2004;44:500-08.
- ↑ Uchida Y, Nakashima T, Ando F, Niino N, Shimokata H. Prevalence of Self-perceived Auditory Problems and their Relation to Audiometric Thresholds in a Middle-aged to Elderly Population. Acta. Otolaryngol. 2003;123:618-26.
- ↑ 21.0 21.1 21.2 21.3 21.4 Plomp, R. Auditory handicap of hearing impairment and the limited benefit of hearing aids. J. Acoust. Soc. Am. 1978;63:533-49.
External links[]
- EMedicine.com.
- GPNotebook.co.uk.
- Answers.com.
- Springerlink.com.
- Audition Cochlea Promenade oreille ear organ Corti C.R.I.C Montpellier. This website provides excellent diagrams and animated pictures that aid understanding of the topics covered. There are a wide range of topics covered including sound, cochlea, Organ of Corti,hair cell pathology and audiometry.
- RNID (Royal National Institute for the Deaf) website. This site includes useful information on hearing loss and provides information for health professionals. Also, at http://www.rnid.org.uk/howwehelp/research_and_technology/rnid_research_grants/device_projects/cochlear_dead_regions/ within this site, there is information on a research project that is aiming to develop a test for dead regions.
- Audiology Resources. This site provides useful resources for people interested in audiology.
- British Society of Audiology. The BSA recommended procedures are available to download at this site.
- Deafness Research UK. This site contains facts about deafness, and has an extensive collection of factsheets available. Also, there is information about research projects and the latest research developments. One of the research projects featured is on dead regions.
| This page uses Creative Commons Licensed content from Wikipedia (view authors). |