No edit summary |
m (fixing dead links) |
||
| (9 intermediate revisions by 4 users not shown) | |||
| Line 1: | Line 1: | ||
{{BioPsy}} |
{{BioPsy}} |
||
| + | [[Image:Spike-waves.png|thumb|Spike waves.]] |
||
| + | '''Electroencephalography''' (EEG) is the measurement of [[electrical]] activity produced by the [[brain]] as recorded from [[electrodes]] placed on the scalp and displayed as a [[electrocardiogram]]. |
||
| + | Just as the activity in a computer can be perceived on multiple different levels, from the activity of individual transistors to the function of applications, so can the electrical activity of the brain be described on relatively small to relatively large scales. At one end are [[action potential|action potentials]] in a single [[axon]] or currents within a single [[dendrite]], and at the other end is the activity measured by the scalp EEG. |
||
| − | '''Electroencephalography''' is the [[neurophysiology|neurophysiologic]] measurement of the electrical activity of the [[brain]] by recording from electrodes placed on the scalp or, in special cases, on the [[cortex]]. The resulting traces are known as an '''electroencephalogram (EEG)''' and represent so-called '''brainwaves'''. This device is used to assess [[brain damage]], [[epilepsy]] and other problems. In some jurisdictions it is used to assess [[brain death]]. EEG can also be used in conjunction with other types of [[neuroimaging]]. |
||
| + | The data measured by the scalp EEG are used for clinical and research purposes. A technique similar to the EEG is intracranial EEG (icEEG), also referred to as subdural EEG (sdEEG) and electrocorticography (ECoG). These terms refer to the recording of activity from the surface of the brain (rather than the scalp). Because of the filtering characteristics of the skull and scalp, icEEG activity has a much higher spatial resolution than surface EEG. |
||
| − | [[neuroscience|Neuroscientists]] and biological psychiatrists use EEGs to study the function of the brain by recording brainwaves during controlled behavior of human volunteers and animals in lab experiments. Theories to explain [[sleep]] often rely on EEG patterns recorded during sleep sessions. In addition, the procedure is used clinically to assist in the diagnosis of [[epilepsy]]. |
||
| − | [[Image:1st-eeg.gif|right|frame|The first EEG recording, obtained by [[Hans Berger]] in 1929.]] |
||
| + | == Source of EEG Activity == |
||
| − | ==Methods== |
||
| + | Scalp EEG measures summated activity of post-synaptic currents. An action potential in a pre-synaptic axon causes the release of [[neurotransmitter]] into the [[synapse]]. The neurotransmitter diffuses across the synaptic cleft and binds to receptors in a post-synaptic dendrite. The activity of many types of receptors results in a flow of ions into or out of the dendrite. This results in compensatory currents in the [[extracellular]] space. It is these extracellular currents which are responsible for the generation of EEG voltages. The EEG is not sensitive to axonal action potentials. |
||
| − | The recording is obtained by placing [[electrode]]s on the scalp, usually after preparing the scalp area by light abrasion and application of a conductive gel to reduce [[impedance]]. Each electrode is connected to an input of a [[differential amplifier]] (one amplifier per pair of electrodes), which amplifies the voltage between them (typically 1,000–100,000 times, or 60–100 [[decibel|dB]] of voltage gain), and then displays it on a screen or inputs it to a computer. The amplitude of the EEG is about 100 µV when measured on the scalp, and about 1-2 mV when measured on the surface of the brain. |
||
| + | While it is post-synaptic potentials which generate the EEG signal, it is not possible to determine the activity within a single dendrite or neuron from the scalp EEG. Rather, surface EEG is the summation of the synchronous activity of thousands of neurons that have similar spatial orientation, radial to the scalp. Currents that are tangential to the scalp are not picked up by the EEG. The EEG therefore benefits from the parallel, radial arrangement of apical dendrites in the cortex. Because voltage fields fall off with the fourth power of the radius, activity from deep sources is more difficult to detect than currents near the skull. |
||
| − | The electrode-amplifier relationships are typically arranged in one of three ways: |
||
| − | {{BioPsy}} |
||
| − | ; Common reference derivation : One terminal of each amplifier is connected to the same electrode, and all other electrodes are measured relative to this single point. It is typical to use a reference electrode placed somewhere along the scalp midline, or a reference that links both earlobe electrodes. |
||
| − | ; Average reference derivation : The outputs of all of the amplifiers are summed and averaged, and this averaged signal is used as the common reference for each amplifier. |
||
| − | ; Bipolar derivation : The electrodes are connected in series to an equal number of amplifiers. For example, amplifier 1 measures the difference between electrodes A and B, amplifier 2 measures the difference between B and C, and so on. |
||
| + | Scalp EEG activity is comprised of multiple oscillations. These have a different characteristic frequencies, spatial distributions and associations with different states of brain functioning (such as awake vs. asleep). These oscillations represent synchronized activity over a network of neurons. The neuronal network underlying some of these oscillations are understood (such as the thalomocortical resonance underlying sleep spindles), while many others are not (e.g., the system that generates the posterior basic rhythm still defies understanding). |
||
| − | This distinction has become void with the advent of computerized or ''paperless'' EEGs, which record all electrodes against an arbitrary reference and will calculate the above montages post hoc. |
||
| + | == Clinical use == |
||
| − | EEG has several limitations. Scalp electrodes are not sensitive enough to pick out individual [[action potential]]s, the electric unit of signaling in the brain, or whether the resulting electrical activity is releasing inhibitory, excitatory or modulatory [[neurotransmitter]]s. Instead, the EEG picks up synchronization of [[neuron]]s, which produces a greater voltage than the firing of an individual neuron. Secondly, EEG has limited anatomical specificity when compared with other functional brain imaging techniques such as [[functional magnetic resonance imaging]] (fMRI). Some anatomical specificity can be gained with the use of [[EEG topography]], which uses a large number of electrodes to [[triangulation|triangulate]] the source of the electrical activity. |
||
| + | A routine clinical EEG recording typically lasts 20-40 minutes. During this time, it is common to perform different "activation procedures" which may evoke different activity than is seen during the resting awake state. These activation procedures include sleep, intermittent photic stimulation with a strobe light, hyperventilation and eye closure. When a routine EEG is done in a patient with suspected or known epilepsy, often it is to look for inter-ictal discharges (i.e., abnormal activity resulting from "brain irritability" that shows a possible predisposition to epileptic seizures. |
||
| + | In certain cases, video-EEG monitoring may be required. This is simultaneous recording of EEG and time-locked video/audio. Video-EEG monitoring may involve inpatient admissions for days to weeks. During these admissions, a patient's anti-epilpetic medications are often titrated off so that seizures can be recorded. The EEG appearance of the onset of the seizure can provide significantly more definitive information about the patient's epilepsy than inter-ictal recordings can in many cases. |
||
| − | EEG has several strong sides as a tool of exploring the brain activity. The time resolution is very high. As other methods for researching brain activity have time resolution between seconds and minutes, the EEG has a resolution down to sub-millisecond. The brain is thought to work through its electric activity. EEG is the only method to measure it directly. Other methods for exploring functions in the brain do rely on blood flow or metabolism which may be decoupled from the brain electric activity. Newer research typically combines EEG or [[Magnetoencephalography|MEG]] with [[Magnetic resonance imaging|MRI]] or [[Positron emission tomography|PET]] to get high temporal and spatial resolution. |
||
| + | Continuous EEG monitoring typically involves the use of a portable EEG machine connected to an ICU patient to look for seizure activity that is not apparent clinically (i.e., in the patient's mental status or by observing his/her movements). When patients are put into medically-induced comas, the EEG pattern may be used as measure of depth of coma, and the medication may be titrated to an EEG end-point. "Amplitude-integrated EEG" refers to a specific representation of the EEG signal that is used with continuous monitoring of cerebral function in some neonatal ICUs. |
||
| − | ==Wave types== |
||
| + | These various forms of EEG recording can be used in the following clinical situations: |
||
| − | [[Image:eeg_raw.svg|thumb|One second of EEG signal|400px|right]] |
||
| + | * to distinguish [[epilepsy|epileptic]] [[seizure]]s from other types of spells, such as [[psychogenic non-epileptic seizures]], [[fainting|syncope (fainting)]], sub-cortical [[movement disorder]]s and [[migraine]] variants. |
||
| − | Historically four major types of continuous rhythmic sinusoidal EEG waves are recognized (alpha, beta, delta and theta). There is no precise agreement on the frequency ranges for each type. |
||
| + | * to [[seizure types|characterize seizures]] for the purposes of treatment |
||
| − | *[[Delta wave|Delta]] is the frequency range up to 4 Hz and is often associated with the very young and certain [[Encephalopathy|encephalopathies]] and underlying lesions. It is seen in deep sleep. |
||
| + | * to localize the region of brain from which a seizure originates for work-up of possible seizure surgery |
||
| − | [[Image:eeg_delta.svg|thumb|Delta waves.|400px|right]] |
||
| + | * to monitor for non-convulsive seizures/non-convulsive status epilepticus |
||
| − | *[[Theta wave|Theta]] is the frequency range from 4 Hz to 8 Hz and is associated with drowsiness, childhood, adolescence and young adulthood. This EEG frequency can sometimes be produced by [[hyperventilation]]. Theta waves can be seen during [[Hypnagogic_state|hypnagogic]] states such as trances, [[hypnosis]], deep day dreams, [[lucid dreaming]] and light [[sleep]] and the preconscious state just upon waking, and just before falling asleep. |
||
| + | * to differentiate "organic" [[encephalopathy]] or [[delirium]] from primary psychiatric syndromes such as [[catatonia]] |
||
| − | [[Image:eeg_theta.svg|thumb|Theta waves.|400px|right]] |
||
| + | * monitoring depth of [[anesthesia]] |
||
| − | *[[Alpha waves|Alpha]] ([[Hans Berger|Berger]]'s wave) is the frequency range from 8 [[Hertz|Hz]] to 12 Hz. It is characteristic of a relaxed, alert state of consciousness and is present by the age of two years. Alpha rhythms are best detected with the eyes closed. Alpha attenuates with drowsiness and open eyes, and is best seen over the occipital (visual) cortex. An alpha-like normal variant called mu is sometimes seen over the motor cortex (central scalp) and attenuates with movement, or rather with the intention to move. |
||
| + | * as an indirect indicator of cerebral perfusion in [[carotid endarterectomy]] |
||
| − | [[Image:eeg_alpha.svg|thumb|Alpha waves.|400px|right]] |
||
| + | * to serve as an adjunct test of [[brain death]] |
||
| − | *[[sensorimotor rhythm]] (SMR) is a middle frequency (about 12–16 Hz) associated with physical stillness and body presence. |
||
| + | * to prognosticate, in certain instances, in patients with coma |
||
| − | [[Image:eeg_SMR.svg|thumb|SMR waves.|400px|right]] |
||
| − | *[[Beta wave|Beta]] is the frequency range above 12 Hz. Low amplitude beta with multiple and varying frequencies is often associated with active, busy or anxious thinking and active concentration. Rhythmic beta with a dominant set of frequencies is associated with various pathologies and drug effects. |
||
| − | [[Image:eeg_beta.svg|thumb|Beta waves.|400px|right]] |
||
| − | *[[Gamma wave|Gamma]] is the frequency range approximately 26–80 Hz. Gamma rhythms appear to be involved in higher mental activity, including perception, problem solving, fear, and consciousness. |
||
| − | [[Image:eeg_gamma.svg|thumb|Gamma waves.|400px|right]] |
||
| − | Rhythmic slow activity in wakefulness is common in young children, but is abnormal in adults. In addition to the above types of rhythmic activity, individual transient waveforms such as sharp waves, spikes, spike-and-wave complexes occur in epilepsy, and other types of transients occur during sleep. |
||
| + | Use of the quantitative EEG (mathematical measurement of aspects of the EEG signal) in primary psychiatric, behavioral and learning disorders is somewhat controversial. |
||
| − | In the transition from wakefulness, through Stage I sleep (drowsiness), Stage II (light) sleep, to Stage III and IV (deep) sleep, first the alpha becomes intermittent and attenuated, then disappears. Stage II sleep is marked by brief bursts of highly rhythmic beta activity (sleep spindles) and K complexes (transient slow waves associated with spindles, often triggered by an auditory stimulus). Stage III and IV are characterized by slow wave activity. |
||
| − | After a period of deep sleep, the sleeper cycles back to stage II sleep and/or [[rapid eye movement]] (REM) sleep, associated with dreaming. These cycles may occur many times during the night. |
||
| + | == Research use == |
||
| − | EEG under general anesthesia depends on the type of anesthetic employed. With halogenated anesthetics and intravenous agents such as [[propofol]], a rapid (alpha or low beta), nonreactive EEG pattern is seen over most of the scalp, especially anteriorly; in some older terminology this was known as a WAR (widespread anterior rapid) pattern, contrasted with a WAIS (widespread slow) pattern associated with high doses of [[opiate]]s. |
||
| + | [[Image:1st-eeg.png|right|frame|An early EEG recording, obtained by [[Hans Berger]] in 1924. The upper tracing is EEG, and the lower is a timing signal.]] |
||
| + | There are a number of benefits to using EEG in [[neuroscience]] research. One is that EEG is [[non-invasive]] to the [[research subject]]. Furthermore, the need for the subject to hold still is perhaps less stringent than in [[functional magnetic resonance imaging|functional magnetic resonance imaging (fMRI)]]. Another benefit is that many applications of EEG record spontaneous brain activity, and the subject does not need to be able to cooperate with the research (e.g., as is necessary in the behavioral testing of [[neuropsychology]]). Also, EEG has a high temporal resolution compared to techniques such as [[functional magnetic resonance imaging|fMRI]] and is capable of detecting changes in electrical activity in the brain on a millisecond time scale. |
||
| + | Much of the cognitive research conducted with EEG uses the [[event-related potential]] (ERP) technique. Most ERP paradigms involve a subject being provided a stimulus to react to either overtly or covertly. There are often at least two conditions that vary in some manner of interest to the researcher. As this stimulus-response is going on, an EEG is being recorded from the subject. The ERP is obtained by averaging the EEG signal from each of the trials within a certain condition; averages from one stimulus-response condition can then be compared with averages from the other stimulus-response condition(s). |
||
| − | ==History== |
||
| − | [[Richard Caton]] ([[1842]]–[[1926]]), a physician practicing in [[Liverpool]], presented his findings about electrical phenomena of the exposed cerebral hemispheres of rabbits and monkeys in [[1875]]. |
||
| + | == Method == |
||
| − | In [[1913]], Russian physiologist, Vladimir Vladimirovich [[Pravdich-Neminsky]] published the first EEG and the [[evoked potential]] of the [[mammalian]] (dog){{ref|1}}. |
||
| + | [[Image:Electroencephalograph Neurovisor-BMM 40 (close view).jpg|thumb|Computer Electroencephalograph ''Neurovisor-BMM 40'']] |
||
| + | In conventional scalp EEG, the recording is obtained by placing [[electrode]]s on the scalp with a conductive gel or paste, usually after preparing the scalp area by light abrasion to reduce [[Electrical impedance|impedance]] due to dead skin cells. The technique has been advanced by the use of carbon nanotubes to penetrate the outer layers of the skin for improved electrical contact. The sensor is known as ENOBIO |
||
| + | <ref>{{cite journal | author = G. Ruffini, S. Dunne, L. Fuentemilla, C. Grau, E. Farres, J. Marco-Pallares, P. C. P. Watts, S. R. P. Silva | year = 2007 | month = 01 | title = '''First human trials of a dry electrophysiology sensor using a carbon nanotube array interface.''' | journal = arXiv.org | volume = | issue = arXiv:physics/0701159v1 | pages = | id = | url = http://arxiv.org/abs/physics/0701159v1}}</ref>; however, this technique is not in common research or clinical use. Many systems typically use electrodes, each of which is attached to an individual wire. Some systems use caps or nets into which electrodes are embedded; this is particularly common when high-density arrays of electrodes are needed. |
||
| + | Electrode locations and names are specified by the [[10-20 system (EEG)|International 10–20 system]] for most clinical and research applications (except when high-density arrays are used). This system ensures that the naming of electrodes is consistent across laboratories. In most clinical applications, 19 recording electrodes (plus ground and system reference) are used. A smaller number of electrodes are typically used when recording EEG from [[infant|neonates]]. Additional electrodes can be added to the standard set-up when a clinical or research application demands increased spatial resolution for a particular area of the brain. High-density arrays (typically via cap or net) can contain up to 256 electrodes more-or-less evenly spaced around the scalp. |
||
| − | German physiologist [[Hans Berger]] ([[1873]]–[[1941]]) began his studies of the human EEG in [[1920]]. He gave the device its name and is sometimes credited with inventing the EEG, though others had performed similar experiments. His work was later expanded by [[Edgar Douglas Adrian]]. |
||
| + | Each electrode is connected to one input of a [[differential amplifier]] (one amplifier per pair of electrodes); a common system reference electrode is connected to the other input of each differential amplifier. These amplifiers amplify the voltage between the active electrode and the reference (typically 1,000–100,000 times, or 60–100 [[decibel|dB]] of voltage gain). In analog EEG, the signal is then filtered (next paragraph), and the EEG signal is output as the deflection of pens as paper passes underneath. Most EEG systems these days, however, are digital, and the amplified signal is digitized via an [[analog-to-digital converter]], after being passed through an [[anti-aliasing filter]]. Analog-to-digital sampling typically occurs at 256-512 Hz in clinical scalp EEG; sampling rates of up to 10 kHz are used in some research applications. |
||
| − | In the 1950s, English physician [[William Grey Walter]] developed an adjunct to EEG called [[EEG topography]] which allowed for the mapping of electrical activity across the surface of the brain. This enjoyed a brief period of popularity in the 1980's and seemed especially promising for psychiatry. It was never accepted by neurologists and remains a primarily a research tool up to now. |
||
| + | The digital EEG signal is stored electronically and can be filtered for display. Typical settings for the [[high-pass filter]] and a [[low-pass filter]] are 0.5-1 [[hertz|Hz]] and 35–70 Hz, respectively. The high-pass filter typically filters out slow artifact, such as [[Galvanic skin response|electrogalvanic]] signals and movement artifact, whereas the low-pass filter filters out high-frequency artifacts, such as [[electromyography|electromyographic]] signals. An additional [[band-stop filter|notch filter]] is typically used to remove artifact caused by electrical power lines (60 Hz in the United States and 50 Hz in many other countries). |
||
| − | In [[2004]], [[Antoine Lutz]] et al., collaborating with [[Richard J. Davidson]], reported that long-term [[meditation | meditator]]s could "self-induce high-amplitude gamma synchrony during mental practice" in the [[Proceedings of the National Academy of Sciences]]{{ref|2}}. |
||
| + | As part of an evaluation for epilepsy surgery, it may be necessary to insert electrodes near the surface of the brain, under the surface of the [[dura mater]]. This is accomplished via burr hole or [[craniotomy]]. This is referred to variously as [[electrocorticography|"electrocorticography (ECoG)"]], "intracranial EEG (I-EEG)" or "sub-dural EEG (SD-EEG)". Depth electrodes may also be placed into brain structures, such as the [[amygdala]] or [[hippocampus]], structures which are common epileptic foci and may not be "seen" clearly by scalp EEG. The electrocorticographic signal is processed in the same manner as digial scalp EEG (above), with a couple of caveats. ECoG is typically recorded at higher sampling rates than scalp EEG because of the requirements of [[Nyquist–Shannon sampling theorem|Nyquist theorem]]—the sub-dural signal is composed of a higher predominance of higher frequency components. Also, many of the artifacts which affect scalp EEG do not impact ECoG, and therefore display filtering is often not needed. |
||
| − | ==Notes== |
||
| − | # {{note|1}} Pravdich-Neminsky VV. Ein Versuch der Registrierung der elektrischen Gehirnerscheinungen (In German). Zbl Physiol 27: 951–960, 1913. |
||
| − | # {{note|2}} Antoine Lutz et al. "Long-term meditators self-induce high-amplitude gamma synchrony during mental practice". ''[[Proceedings of the National Academy of Sciences]]'' 101:46, 16369-16373, 2004. ([http://www.pubmedcentral.gov/articlerender.fcgi?tool=pubmed&pubmedid=15534199 full text]) |
||
| + | A typical adult human EEG signal is about 10-100 µV in amplitude when measured from the scalp <ref name="aurlien_2004">{{cite journal | author = H. Aurlien, I.O. Gjerde, J. H. Aarseth, B. Karlsen, H. Skeidsvoll, N. E. Gilhus | year = 2004 | month = 03 | title = '''EEG background activity described by a large computerized database.''' | journal = Clinical Neurophysiology | volume =115 | issue =3 | pages = 665-673 | id = | url = }}</ref> and is about 10–20 mV when measured from subdural electrodes. |
||
| − | ==See also== |
||
| + | |||
| − | * [[Neural oscillations]] |
||
| + | Since an EEG voltage signal represents a difference between the voltages at two electrodes, the display of the EEG for the reading encephalographer may be set up in one of several ways. The representation of the EEG channels is referred to as a ''montage.'' |
||
| + | |||
| + | ; Bipolar montage : Each channel (i.e., waveform) represents the difference between two adjacent electrodes. The entire montage consists of a series of these channels. For example, the channel "Fp1-F3" represents the difference in voltage between the Fp1 electrode and the F3 electrode. The next channel in the montage, "F3-C3," represents the voltage difference between F3 and C3, and so on through the entire array of electrodes. |
||
| + | |||
| + | ; Referential montage: Each channel represents the difference between a certain electrode and a designated reference electrode. There is no standard position at which this reference is always placed; it is, however, at a different position than the "recording" electrodes. Midline positions are often used because they do not amplify the signal in one hemisphere vs. the other. Another popular reference is "linked ears," which is a physical or mathematical average of electrodes attached to both earlobes or [[mastoid process|mastoids]]. |
||
| + | |||
| + | ; Average reference montage : The outputs of all of the amplifiers are summed and averaged, and this averaged signal is used as the common reference for each channel. |
||
| + | |||
| + | ; Laplacian montage : Each channel represents the difference between an electrode and a weighted average of the surrounding electrodes. |
||
| + | |||
| + | When analog (paper) EEGs are used, the technologist switches between montages during the recording in order to highlight or better characterize certain features of the EEG. With digital EEG, all signals are typically digitized and stored in a particular (usually referential) montage; since any montage can be constructed mathematically from any other, the EEG can be viewed by the electroencephalographer in any display montage that is desired. |
||
| + | |||
| + | ===Limitations=== |
||
| + | EEG has several limitations. Most important is its poor spatial resolution. EEG is most sensitive to a particular set of post-synaptic potentials: those which are generated in superficial layers of the cortex, on the crests of [[gyrus|gyri]] directly abutting the skull and radial to the skull. Dendrites which are deeper in the cortex, inside [[sulcus (neuroanatomy)|sulci]], are in midline or deep structures (such as the [[cingulate gyrus]] or [[hippocampus]]) or produce currents which are tangential to the skull have far less contribution to the EEG signal. |
||
| + | |||
| + | The [[meninges]], [[cerebrospinal fluid]] and skull "smear" the EEG signal, obscuring its intracranial source. |
||
| + | |||
| + | It is mathematically impossible to reconstruct a unique intercranial current source for a given EEG signal, as some currents produce potentials that cancel each other out. This is referred to as the [[inverse problem]]. However, much work has been done to produce remarkably good estimates of, at least, a localized [[electric dipole]] that represents the recorded currents. |
||
| + | |||
| + | ===Advantages=== |
||
| + | EEG has several strong sides as a tool of exploring brain activity; for example, its time resolution is very high (on the level of a single millisecond). Other methods of looking at brain activity, such as [[Pet scan|PET]] and [[fMRI]] have time resolution between seconds and minutes. EEG measures the brain's electrical activity directly, while other methods record changes in blood flow (e.g., [[Single photon emission computed tomography|SPECT]], [[functional magnetic resonance imaging|fMRI]]) or metabolic activity (e.g., [[Positron emission tomography|PET]]), which are indirect markers of brain electrical activity. EEG can be used simultaneously with [[functional magnetic resonance imaging|fMRI]] so that high-temporal-resolution data can be recorded at the same time as high-spatial-resolution data, however, since the data derived from each occurs over a different time course, the data sets do not necessarily represent the exact same brain activity. There are technical difficulties associated with combining these two modalities, including the need to remove RF pulse artifact and ballistocardiographic artifact (a results from the movement of pulsed blood) from the EEG. Furthermore, currents can be induced in moving EEG electrode wires due to the magnetic field of the MRI. |
||
| + | |||
| + | EEG can be recorded at the same time as [[Magnetoencephalography|MEG]] so that data from these complimentary high-time-resolution techniques can be combined. |
||
| + | |||
| + | ==Normal activity== |
||
| + | [[Image:eeg raw.svg|thumb|One second of EEG signal|400px|right]] |
||
| + | The EEG typically described in terms of (1) rhythmic activity and (2) transients. The rhythmic activity is divided into bands by frequency. To some degree, these frequency bands are a matter of nomenclature (i.e., any rhythmic activity between 8-12 Hz can be described as "alpha"), but these designations arose because rhythmic activity within a certain frequency range was noted to have a certain distribution over the scalp or a certain biological significance. |
||
| + | |||
| + | Most of the cerebral signal observed in the scalp EEG falls in the range of 1-20 Hz (activity below or above this range is likely to be artifactual, under standard clinical recording techniques): |
||
| + | |||
| + | [[Image:eeg delta.svg|thumb|[[delta waves]].|400px|right]] |
||
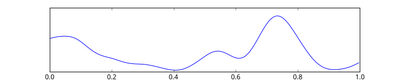
| + | *[[Delta wave|Delta]] is the frequency range up to 3 Hz. It tends to be the highest in amplitude and the slowest waves. It is seen normally in adults in [[NREM|slow wave sleep]]. It is also seen normally in babies. It may occur focally with subcortical lesions and in general distribution with diffuse lesions, metabolic encephalopathy hydrocephalus or deep midline lesions. It is usually most prominent frontally in adults (e.g. FIRDA - Frontal Intermittent Rhythmic Delta) and posteriorly in chilldren e.g. OIRDA - Occipital Intermittent Rhythmic Delta). |
||
| + | |||
| + | [[Image:eeg theta.svg|thumb|[[theta waves]].|400px|right]] |
||
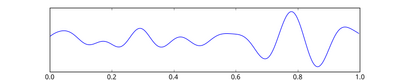
| + | *[[Theta wave|Theta]] is the frequency range from 4 Hz to 7 Hz. Theta is seen normally in young children. It may be seen in drowsiness or arousal in older children and adults; it can also be seen in [[meditation]]. Excess theta for age represents abnormal activity. It can be seen as a focal disturbance in focal subcortical lesions; it can be seen in generalized distribution in diffuse disorder or metabolic encephalopathy or deep midline disorders or some instances of hydrocephalus. |
||
| + | |||
| + | [[Image:eeg alpha.svg|thumb|[[alpha waves]].|400px|right]] |
||
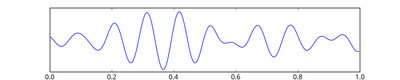
| + | *[[alpha waves|Alpha]] is the frequency range from 8 [[Hertz|Hz]] to 12 Hz. [[Hans Berger]] named the first rhythmic EEG activity he saw, the "alpha wave." This is activity in the 8-12 Hz range seen in the posterior regions of the head on both sides, being higher in amplitude on the dominant side. It is brought out by closing the eyes and by relaxation. It was noted to attenuate with eye opening or mental exertion. This activity is now referred to as "posterior basic rhythm," the "posterior dominant rhythm" or the "posterior alpha rhythm." The posterior basic rhythm is actually slower than 8 Hz in young children (therefore technically in the theta range). In addition to the posterior basic rhythm, there are two other normal alpha rhythms that are typically discussed: the mu rhythm and a temporal "third rhythm". Alpha can be abnormal; for example, an EEG that has diffuse alpha occurring in coma and is not responsive to external stimuli is referred to as "alpha coma". |
||
| + | |||
| + | [[Image:eeg SMR.svg|thumb|[[Sensorimotor rhythm]] aka [[mu rhythm]].|400px|right]] |
||
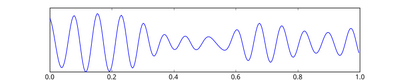
| + | *[[Mu rhythm]] is alpha-range activity that is seen over the sensorimotor cortex. It characteristically attenuates with movement of the contralateral arm (or mental imagery of movement of the contralateral arm). |
||
| + | |||
| + | [[Image:eeg beta.svg|thumb|[[beta wave]]s.|400px|right]] |
||
| + | *[[Beta wave|Beta]] is the frequency range from 12 Hz to about 30 Hz. It is seen usually on both sides in symmetrical distribution and is most evident frontally. Low amplitude beta with multiple and varying frequencies is often associated with active, busy or anxious thinking and active concentration. Rhythmic beta with a dominant set of frequencies is associated with various pathologies and drug effects, especially [[benzodiazepines]]. Activity over about 25 Hz seen in the scalp EEG is rarely cerebral (i.e., it is most often artifactual). It may be absent or reduced in areas of cortical damage. It is the dominant rhythm in patients who are alert or anxious or who have their eyes open. |
||
| + | |||
| + | [[Image:eeg gamma.svg|thumb|[[gamma waves]].|400px|right]] |
||
| + | *[[Gamma wave|Gamma]] is the frequency range approximately 26–100 Hz. Because of the filtering properties of the skull and scalp, gamma rhythms can only be recorded from electrocorticography or possibly with [[magnetoencephalography]]. Gamma rhythms are thought to represent binding of different populations of neurons together into a network for the purpose of carrying out a certain cognitive or motor function. |
||
| + | |||
| + | "Ultra-slow" or "near-DC" activity is recorded using DC amplifiers in some research contexts. It is not typically recorded in a clinical context because the signal at these frequencies is susceptible to a number of artifacts. |
||
| + | |||
| + | Some features of the EEG are transient rather than rhythmic. Spikes and sharp waves may represent seizure activity or [[interictal]] activity in individuals with epilepsy or a predisposition toward epilepsy. Other transient features are normal: vertex waves and sleep spindles are transient events which are seen in normal sleep. |
||
| + | |||
| + | It should also be noted that there are types of activity which are statistically uncommon but are not associated with dysfunction or disease. These are often referred to as "normal variants." The mu rhythm is an example of a normal variant. |
||
| + | |||
| + | The normal EEG varies by age. The neonatal EEG is quite different from the adult EEG. The EEG in childhood is generally comprised of slower frequency oscillations than the adult EEG. |
||
| + | |||
| + | The normal EEG also varies depending on state. The EEG is used along with other measurements ([[EOG]], [[electromyography|EMG]]) to define [[sleep|sleep stages]] in [[polysomnography]]. Stage I sleep (equivalent to drowsiness in some systems) appears on the EEG as drop-out of the posterior basic rhythm. There can be an increase in theta frequencies. Santamaria and Chiappa cataloged a number of the variety of patterns associated with drowsiness. Stage II sleep is characterized by sleep spindles--transient runs of rhythmic activity in the 12-14 Hz range (sometimes referred to as the "sigma" band) that have a frontal-central maximum. Most of the activity in Stage II is in the 3-6 Hz range. Stage III and IV sleep are defined by the presence of delta frequences and are often referred to collectively as "slow-wave sleep." Stages I-IV are comprise non-REM (or "NREM") sleep. The EEG in REM (rapid eye movement) sleep appears somewhat similar to the awake EEG. |
||
| + | |||
| + | EEG under general anesthesia depends on the type of anesthetic employed. With halogenated anesthetics, such as [[halothane]] or intravenous agents, such as [[propofol]], a rapid (alpha or low beta), nonreactive EEG pattern is seen over most of the scalp, especially anteriorly; in some older terminology this was known as a WAR (widespread anterior rapid) pattern, contrasted with a WAIS (widespread slow) pattern associated with high doses of [[opiate]]s. Anesthetic effects on EEG signals are beginning to be understood at the level of drug actions on different kinds of synapses and the circuits that allow synchronized neuronal activity (see: http://www.stanford.edu/group/maciverlab/). |
||
| + | |||
| + | ==Artifacts== |
||
| + | ===Biological artifacts=== |
||
| + | Signals in the EEG that are of non-cerebral origin are called [[Artifact (observational)|artifacts]]. The EEG is nearly always contaminated by such signals. This is one of the reasons why it takes considerable experience to interpret EEGs clinically. The most common types of artifacts are: |
||
| + | * Eye artifacts (including eyeball, ocular muscles and eyelid) |
||
| + | * [[Electrocardiogram|EKG]] artifacts |
||
| + | * [[Electromyography|EMG]] artifacts |
||
| + | * Glossokinetic artifacts |
||
| + | |||
| + | Eyeball artifacts are caused by the potential difference between the [[cornea]] and [[retina]], which is quite large compared to cerebral potentials. When the eye is completely still, this is not a problem. But there are nearly always small or large reflexive eye movements, which generates a potential which is picked up in the frontopolar and frontal leads. Eye movements - whether vertical or horizontal [saccades] - are caused by ocular muscles, which also generate [[electromyography|electromyographic]] potentials. Purposeful or reflexive eye blinking also generates [[electromyography|electromyographic]] potentials, but more importantly there is reflexive movement of the eyeball during blinking which gives a characteristic artefactual appearance of the EEG (see [[Bell's phenomenon]]). |
||
| + | |||
| + | Eyelid fluttering artifacts of a characteristic type were previously called Kappa rhythm (or Kappa waves). It is usually seen in the prefrontal leads, that is, just over the eyes. Sometimes they are seen with mental activity. They are usually in the Theta (4–7 Hz) or Alpha (8–13 Hz) range. They were named because they were believed to originate from the brain. Later study revealed they were generated by rapid fluttering of the eyelids, sometimes so minute that it was difficult to see. They are in fact noise or "artifact" in the EEG reading, and should not technically be called a rhythm or wave. Therefore, the term Kappa rhythm (or wave) is no longer used in electroencephalography. It should be described as eyelid fluttering artifact.<ref name="recom_clin_neurophys_1983>{{cite book | last = Epstein | first = Charles M. | title = Introduction to EEG and evoked potentials | publisher = J. B. Lippincot Co. | date = 1983 | id = ISBN 0-397-50598-1 }}</ref> |
||
| + | |||
| + | Some of these artifacts are useful. Eye movements are very important in [[polysomnography]], and is also useful in conventional EEG for assessing possible changes in alertness, drowsiness or sleep. |
||
| + | |||
| + | EKG artifacts are quite common and can be mistaken for spike activity. Because of this, modern EEG acquisition commonly includes a one-channel EKG from the extremities. This also allows the EEG to identify [[cardiac arrythmia]]s that are an important [[differential diagnosis]] to [[Fainting|syncope]] or other episodic/attack disorders. Glossokinetic artifacts are caused by the potential difference between the base and the tip of the tongue. Minor tongue movements can contaminate the EEG, especially in [[Parkinson's disease|parkinsonian]] and [[tremor]] disorders. |
||
| + | |||
| + | ===External artifacts=== |
||
| + | In addition to internal artifacts, there are many artifacts which originate from outside the patient. Movement by the patient, or even just settling of the electrodes, may cause ''electrode pops'', spikes originating from a momentary change in the [[impedance]] of a given electrode. Poor [[Ground (electricity)|grounding]] of the EEG electrodes can cause significant 50 or 60Hz artifact, depending on the local power system's [[Utility frequency|frequency]]. A third source of possible interference can be the presence of an IV drip; such devices can cause rhythmic, fast, low-voltage bursts, which may be confused for spikes. |
||
| + | |||
| + | ===Artifact correction=== |
||
| + | Recently, source decomposition techniques have been used to correct or remove EEG contaminates. These techniques attempt to "unmix" the EEG signals into some number of underlying components. There are many source separation algorithms, often assuming various behaviors or natures of EEG. Regardless, the principle behind any particular method usually allow "remixing" only those components that would result in "clean" EEG by nullifying (zeroing) the weight of unwanted components. |
||
| + | |||
| + | ==Abnormal Activity== |
||
| + | Abnormal activity can broadly be separated into epileptiform and non-epileptiform activity. It can also be separated into focal or diffuse. |
||
| + | |||
| + | Focal epileptiform discharges represent fast, synchronous potentials in a large number of neurons in a somewhat discrete area of the brain. These can occur as inter-ictal activity, between seizures, and represent an area of cortical irritability that may be predisposed to producing epileptic seizures. Inter-ictal discharges are not wholly reliable for determining whether a patient has epilepsy nor where his/her seizure might originate. (See [[focal epilepsy]].) |
||
| + | |||
| + | Generalized epileptiform discharges often have an anterior maximum, but the are seen synchronously throughout the entire brain. They are strongly suggestive of a generalized epilepsy. |
||
| + | |||
| + | Focal non-epileptiform abnormal activity may occur over areas of the brain where there is focal damage of the cortex or [[white matter]]. It often consists of an increase in slow frequency rhythms and/or a loss of normal higher frequency rhythms. It may also appear as focal or unilateral decrease in amplitude of the EEG signal. |
||
| + | |||
| + | Diffuse non-epileptiform abnormal activity may manifest as diffuse abnormally slow rhythms or bilateral slowing of normal rhythms, such as the PBR. |
||
| + | |||
| + | == History == |
||
| + | A timeline of the history of EEG is given by Swartz.<ref>{{cite journal | author = Swartz, B.E | year = 1998 | month = | title = '''Timeline of the history of EEG and associated fields''' | journal = Electroencephalography and clinical Neurophysiology | volume = 106 | issue = | pages = 173–176 | id = | url = http://www.sciencedirect.com/science?_ob=MImg&_imagekey=B6SYX-4FV4S6H-1-1&_cdi=4846&_user=10&_orig=browse&_coverDate=02%2F28%2F1998&_sk=998939997&view=c&wchp=dGLbVzz-zSkWb&md5=47fbbe7e51a806779716fba415b96ab7&ie=/sdarticle.pdf}}</ref> Richard Caton ([[1842]]–[[1926]]), a physician practicing in [[Liverpool]], presented his findings about electrical phenomena of the exposed cerebral hemispheres of rabbits and monkeys in the British Medical Journal in [[1875]]. In 1890, Beck published an investigation of spontaneous electrical activity of the brain of rabbits and dogs which included rhythmic oscillations altered by light. |
||
| + | |||
| + | In 1912, Russian physiologist, Vladimir Vladimirovich Pravdich-Neminsky published the first EEG and the [[evoked potential]] of the [[mammal]]ian (dog).<ref>Pravdich-Neminsky VV. Ein Versuch der Registrierung der elektrischen Gehirnerscheinungen (In German). Zbl Physiol 27: 951–960, 1913.</ref> In 1914, Cybulsky and Jelenska-Macieszyna photographed EEG-recordings of experimentally induced seizures. |
||
| + | |||
| + | German physiologist [[Hans Berger]] ([[1873]]–[[1941]]) began his studies of the human EEG in [[1920]]. He gave the device its name and is sometimes credited with inventing the EEG, though others had performed similar experiments. His work was later expanded by [[Edgar Douglas Adrian]]. |
||
| + | |||
| + | In 1934, Fisher and Lowenback first demonstrated epileptiform spikes. In 1935 Gibbs, Davis and Lennox described interictal spike waves and the 3 cycles/s pattern of clinical [[absence seizure]]s, which began the field of clinical electroencephalography. Subsequently, in 1936 Gibbs and Jasper reported the interictal spike as the focal signature of epilepsy. The same year, the first EEG laboratory opened at Massachusetts General Hospital. |
||
| + | |||
| + | [[Franklin Offner]] ([[1911]]–[[1999]]), professor of biophysics at [[Northwestern University]] developed a prototype of the EEG which incorporated a piezoelectronic inkwriter called a Crystograph (the whole device was typically known as the Offner Dynograph). |
||
| + | |||
| + | In 1947, The American EEG Society was founded and the first International EEG congress was held. In 1953 Aserinsky and Kleitmean describe REM sleep. |
||
| + | |||
| + | In the 1950s, English physician [[William Grey Walter]] developed an adjunct to EEG called [[EEG topography]] which allowed for the mapping of electrical activity across the surface of the brain. This enjoyed a brief period of popularity in the 1980s and seemed especially promising for psychiatry. It was never accepted by neurologists and remains primarily a research tool. |
||
| + | |||
| + | ==Various uses == |
||
| + | The EEG has been used for many purposes besides the conventional uses of clinical diagnosis and conventional cognitive neuroscience. [[Neurofeedback]] remains an important extension, and in its most advanced form is also attemped as the basis of [[Brain-computer interface|brain computer interfaces]]. There are many commercial products substantially based on the EEG. |
||
| + | |||
| + | For example, as of March 24th [[2007]] a [[US]] company called [http://www.emotiv.com/ Emotiv Systems] launched a mind controlled device for [[video game]]s based on Electroencephalography.<ref>Reporter: Don Clark {{cite web |
||
| + | | url = http://video.msn.com/v/us/fv/msnbc/fv.htm??f=00&g=09e9f856-63f3-40cd-83e6-eb6f2910a31c&p=&t=m5&rf=http://www.msnbc.msn.com/id/17740749/&fg= |
||
| + | | title = Video Mind Control Device |
||
| + | | language = |
||
| + | | accessdate = 2007-03-25 |
||
| + | | year = 2007 |
||
| + | }}</ref>. |
||
| + | |||
| + | <gallery> |
||
| + | Image:Squid MG 0758-d.jpg|Girl wearing electrodes for electroencephalography |
||
| + | Image:EEG_32_electrodes.jpg|Person wearing electrodes for electroencephalography |
||
| + | Image:Vitasport3_2.jpg|Portable recording device for electroencephalography |
||
| + | Image:Musical brainwave performance at deconism gallery.jpg|EEG used during a music performance in which bathers from around the world were networked together as part of a collective musical performance, using their brainwaves to control sound, lighting, and the bath environment |
||
| + | </gallery> |
||
| + | |||
| + | == See also == |
||
| + | |||
| + | <div style="-moz-column-count:3; column-count:3;"> |
||
| + | * [[Brain-computer interface]] |
||
| + | * [[Brainwave synchronization]] |
||
| + | * [http://binauralbeats.wikia.com/wiki/Brainwave_Functions Brainwave Frequencies] |
||
| + | * [http://binauralbeats.wikia.com/wiki/Binaural_Beats_Wiki#See_also Binaural beats] |
||
| + | * [[Cranial Electrobiological Stimulation]] |
||
| + | * [[EEG-fMRI]] |
||
| + | * [[Electrical activity]] |
||
* [[Evoked potential]] |
* [[Evoked potential]] |
||
* [[Event-related potential]] |
* [[Event-related potential]] |
||
| + | * [[Hemoencephalography]] |
||
* [[Induced activity]] |
* [[Induced activity]] |
||
| − | * [[ |
+ | * [[Local field potentials]] |
| + | * [[Magnetoencephalography]] |
||
| + | * [[Mind machine]] |
||
* [[Neurofeedback]] |
* [[Neurofeedback]] |
||
| − | * [[ |
+ | * [[Neural oscillations]] |
| − | * [[ |
+ | * [[Ongoing brain activity]] |
| + | * [[Rheoencephalography]] |
||
| + | </div> |
||
| + | |||
| + | == References == |
||
| + | {{reflist}} |
||
| + | |||
| + | {{EEG}} |
||
== External links == |
== External links == |
||
| + | * [http://pceeg.sourceforge.net/ The open-source programmable chip Electroencephalography project] |
||
| − | *[http://www.ifcn.info/ International Federation of Clinical Neurophysiology] |
||
| − | *[http://www. |
+ | * [http://www.thoughttechnology.com/ The world's largest manufacturer of data acquisition/biofeedback devices] |
| + | * [http://www.opencircuits.com/Programmable_Chip_EEG The programmable chip Electroencephalography project open circuits wiki] |
||
| − | *[http://www.acns.org/ American Clinical Neurophysiology Society] |
||
| + | * [http://pceeg.wikia.com/wiki/Main_Page The programmable chip Electroencephalography project WikiCities wiki] |
||
| − | *[http://biosig.sourceforge.net BioSig] - An open source software library for analyzing EEG and other biosignals |
||
| − | *[http://openeeg.sourceforge.net |
+ | * [http://openeeg.sourceforge.net/doc/ The open-source Electroencephalography project] |
| + | * [http://www.bioera.net/ BioEra] - Cross-Platform EEG Software, of which there is a [[free software]] version (BioEra GPL), and a [[proprietary software]] version. |
||
| − | *[http://neuroimage.usc.edu/brainstorm BrainStorm] - A [[shareware]] [[MATLAB]] software toolbox for electromagnetic functional [[neuroimaging]] using EEG and [[Magnetoencephalography]]. |
||
| + | * [http://www.ifcn.info/ International Federation of Clinical Neurophysiology] |
||
| + | * [http://www.ecnsweb.com The EEG and Clinical Neuroscience Society] |
||
| + | * [http://www.acns.org/ American Clinical Neurophysiology Society] |
||
| + | * [http://www.stanford.edu/group/maciverlab/theta.html Brain Slice EEG models] |
||
| + | * [http://brainwavelab.blogspot.com/ BrainWave Lab - Sound Therapy] |
||
| + | * {{cite news | title=Epileptic Brain Waves | url=http://www.time.com/time/magazine/printout/0,8816,762255,00.html | publisher=Time Magazine | date=[[1935-04-22]] | accessdate=2006-09-05|archiveurl=https://archive.is/B4E5f|archivedate=2013-01-05}} |
||
| + | {{Commonscat|Electroencephalography}} |
||
[[Category:Electroencephalography|*]] |
[[Category:Electroencephalography|*]] |
||
| − | [[Category: |
+ | [[Category:Electrophysiology]] |
| − | [[Category: |
+ | [[Category:Encephalography]] |
| − | [[Category: |
+ | [[Category:Neurophysiology]] |
| + | [[Category:Neurotechnology]] |
||
| + | [[Category:Medical diagnosis]] |
||
| + | [[Category:Brain-computer interfacing]] |
||
| + | <!-- |
||
| + | [[cs:Elektroencefalografie]] |
||
[[da:Elektroencefalografi]] |
[[da:Elektroencefalografi]] |
||
[[de:Elektroenzephalografie]] |
[[de:Elektroenzephalografie]] |
||
| Line 88: | Line 240: | ||
[[fr:Électro-encéphalographie]] |
[[fr:Électro-encéphalographie]] |
||
[[ko:뇌파]] |
[[ko:뇌파]] |
||
| + | [[hr:Elektroencefalograf]] |
||
[[is:Heilarit]] |
[[is:Heilarit]] |
||
| + | [[it:Elettroencefalografia]] |
||
[[he:אלקטרואנצפלוגרם]] |
[[he:אלקטרואנצפלוגרם]] |
||
[[lt:Elektroencefalografija]] |
[[lt:Elektroencefalografija]] |
||
| + | [[hu:Elektro-enkefalográfia]] |
||
[[nl:Elektro-encefalografie]] |
[[nl:Elektro-encefalografie]] |
||
[[ja:脳波]] |
[[ja:脳波]] |
||
| − | [[no: |
+ | [[no:Elektroencefalogram]] |
[[pl:Elektroencefalografia]] |
[[pl:Elektroencefalografia]] |
||
| − | [[pt: |
+ | [[pt:Eletroencefalografia]] |
[[ru:Электроэнцефалография]] |
[[ru:Электроэнцефалография]] |
||
| + | [[sq:Elektroencefalografia]] |
||
| + | [[sk:Elektroencefalografia]] |
||
| + | [[sr:Електроенцефалографија]] |
||
| + | [[fi:EEG]] |
||
[[sv:Elektroencefalografi]] |
[[sv:Elektroencefalografi]] |
||
| + | [[tr:Elektroensefalografi]] |
||
| − | |||
| + | [[ur:برقی دماغی تخطیط]] |
||
| + | --> |
||
{{enWP| Electroencephalography}} |
{{enWP| Electroencephalography}} |
||
Latest revision as of 09:41, 28 August 2014
Assessment |
Biopsychology |
Comparative |
Cognitive |
Developmental |
Language |
Individual differences |
Personality |
Philosophy |
Social |
Methods |
Statistics |
Clinical |
Educational |
Industrial |
Professional items |
World psychology |
Biological: Behavioural genetics · Evolutionary psychology · Neuroanatomy · Neurochemistry · Neuroendocrinology · Neuroscience · Psychoneuroimmunology · Physiological Psychology · Psychopharmacology (Index, Outline)
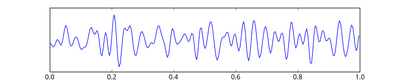
Spike waves.
Electroencephalography (EEG) is the measurement of electrical activity produced by the brain as recorded from electrodes placed on the scalp and displayed as a electrocardiogram.
Just as the activity in a computer can be perceived on multiple different levels, from the activity of individual transistors to the function of applications, so can the electrical activity of the brain be described on relatively small to relatively large scales. At one end are action potentials in a single axon or currents within a single dendrite, and at the other end is the activity measured by the scalp EEG.
The data measured by the scalp EEG are used for clinical and research purposes. A technique similar to the EEG is intracranial EEG (icEEG), also referred to as subdural EEG (sdEEG) and electrocorticography (ECoG). These terms refer to the recording of activity from the surface of the brain (rather than the scalp). Because of the filtering characteristics of the skull and scalp, icEEG activity has a much higher spatial resolution than surface EEG.
Source of EEG Activity
Scalp EEG measures summated activity of post-synaptic currents. An action potential in a pre-synaptic axon causes the release of neurotransmitter into the synapse. The neurotransmitter diffuses across the synaptic cleft and binds to receptors in a post-synaptic dendrite. The activity of many types of receptors results in a flow of ions into or out of the dendrite. This results in compensatory currents in the extracellular space. It is these extracellular currents which are responsible for the generation of EEG voltages. The EEG is not sensitive to axonal action potentials.
While it is post-synaptic potentials which generate the EEG signal, it is not possible to determine the activity within a single dendrite or neuron from the scalp EEG. Rather, surface EEG is the summation of the synchronous activity of thousands of neurons that have similar spatial orientation, radial to the scalp. Currents that are tangential to the scalp are not picked up by the EEG. The EEG therefore benefits from the parallel, radial arrangement of apical dendrites in the cortex. Because voltage fields fall off with the fourth power of the radius, activity from deep sources is more difficult to detect than currents near the skull.
Scalp EEG activity is comprised of multiple oscillations. These have a different characteristic frequencies, spatial distributions and associations with different states of brain functioning (such as awake vs. asleep). These oscillations represent synchronized activity over a network of neurons. The neuronal network underlying some of these oscillations are understood (such as the thalomocortical resonance underlying sleep spindles), while many others are not (e.g., the system that generates the posterior basic rhythm still defies understanding).
Clinical use
A routine clinical EEG recording typically lasts 20-40 minutes. During this time, it is common to perform different "activation procedures" which may evoke different activity than is seen during the resting awake state. These activation procedures include sleep, intermittent photic stimulation with a strobe light, hyperventilation and eye closure. When a routine EEG is done in a patient with suspected or known epilepsy, often it is to look for inter-ictal discharges (i.e., abnormal activity resulting from "brain irritability" that shows a possible predisposition to epileptic seizures.
In certain cases, video-EEG monitoring may be required. This is simultaneous recording of EEG and time-locked video/audio. Video-EEG monitoring may involve inpatient admissions for days to weeks. During these admissions, a patient's anti-epilpetic medications are often titrated off so that seizures can be recorded. The EEG appearance of the onset of the seizure can provide significantly more definitive information about the patient's epilepsy than inter-ictal recordings can in many cases.
Continuous EEG monitoring typically involves the use of a portable EEG machine connected to an ICU patient to look for seizure activity that is not apparent clinically (i.e., in the patient's mental status or by observing his/her movements). When patients are put into medically-induced comas, the EEG pattern may be used as measure of depth of coma, and the medication may be titrated to an EEG end-point. "Amplitude-integrated EEG" refers to a specific representation of the EEG signal that is used with continuous monitoring of cerebral function in some neonatal ICUs.
These various forms of EEG recording can be used in the following clinical situations:
- to distinguish epileptic seizures from other types of spells, such as psychogenic non-epileptic seizures, syncope (fainting), sub-cortical movement disorders and migraine variants.
- to characterize seizures for the purposes of treatment
- to localize the region of brain from which a seizure originates for work-up of possible seizure surgery
- to monitor for non-convulsive seizures/non-convulsive status epilepticus
- to differentiate "organic" encephalopathy or delirium from primary psychiatric syndromes such as catatonia
- monitoring depth of anesthesia
- as an indirect indicator of cerebral perfusion in carotid endarterectomy
- to serve as an adjunct test of brain death
- to prognosticate, in certain instances, in patients with coma
Use of the quantitative EEG (mathematical measurement of aspects of the EEG signal) in primary psychiatric, behavioral and learning disorders is somewhat controversial.
Research use
An early EEG recording, obtained by Hans Berger in 1924. The upper tracing is EEG, and the lower is a timing signal.
There are a number of benefits to using EEG in neuroscience research. One is that EEG is non-invasive to the research subject. Furthermore, the need for the subject to hold still is perhaps less stringent than in functional magnetic resonance imaging (fMRI). Another benefit is that many applications of EEG record spontaneous brain activity, and the subject does not need to be able to cooperate with the research (e.g., as is necessary in the behavioral testing of neuropsychology). Also, EEG has a high temporal resolution compared to techniques such as fMRI and is capable of detecting changes in electrical activity in the brain on a millisecond time scale.
Much of the cognitive research conducted with EEG uses the event-related potential (ERP) technique. Most ERP paradigms involve a subject being provided a stimulus to react to either overtly or covertly. There are often at least two conditions that vary in some manner of interest to the researcher. As this stimulus-response is going on, an EEG is being recorded from the subject. The ERP is obtained by averaging the EEG signal from each of the trials within a certain condition; averages from one stimulus-response condition can then be compared with averages from the other stimulus-response condition(s).
Method
.jpg)
Computer Electroencephalograph Neurovisor-BMM 40
In conventional scalp EEG, the recording is obtained by placing electrodes on the scalp with a conductive gel or paste, usually after preparing the scalp area by light abrasion to reduce impedance due to dead skin cells. The technique has been advanced by the use of carbon nanotubes to penetrate the outer layers of the skin for improved electrical contact. The sensor is known as ENOBIO [1]; however, this technique is not in common research or clinical use. Many systems typically use electrodes, each of which is attached to an individual wire. Some systems use caps or nets into which electrodes are embedded; this is particularly common when high-density arrays of electrodes are needed.
Electrode locations and names are specified by the International 10–20 system for most clinical and research applications (except when high-density arrays are used). This system ensures that the naming of electrodes is consistent across laboratories. In most clinical applications, 19 recording electrodes (plus ground and system reference) are used. A smaller number of electrodes are typically used when recording EEG from neonates. Additional electrodes can be added to the standard set-up when a clinical or research application demands increased spatial resolution for a particular area of the brain. High-density arrays (typically via cap or net) can contain up to 256 electrodes more-or-less evenly spaced around the scalp.
Each electrode is connected to one input of a differential amplifier (one amplifier per pair of electrodes); a common system reference electrode is connected to the other input of each differential amplifier. These amplifiers amplify the voltage between the active electrode and the reference (typically 1,000–100,000 times, or 60–100 dB of voltage gain). In analog EEG, the signal is then filtered (next paragraph), and the EEG signal is output as the deflection of pens as paper passes underneath. Most EEG systems these days, however, are digital, and the amplified signal is digitized via an analog-to-digital converter, after being passed through an anti-aliasing filter. Analog-to-digital sampling typically occurs at 256-512 Hz in clinical scalp EEG; sampling rates of up to 10 kHz are used in some research applications.
The digital EEG signal is stored electronically and can be filtered for display. Typical settings for the high-pass filter and a low-pass filter are 0.5-1 Hz and 35–70 Hz, respectively. The high-pass filter typically filters out slow artifact, such as electrogalvanic signals and movement artifact, whereas the low-pass filter filters out high-frequency artifacts, such as electromyographic signals. An additional notch filter is typically used to remove artifact caused by electrical power lines (60 Hz in the United States and 50 Hz in many other countries).
As part of an evaluation for epilepsy surgery, it may be necessary to insert electrodes near the surface of the brain, under the surface of the dura mater. This is accomplished via burr hole or craniotomy. This is referred to variously as "electrocorticography (ECoG)", "intracranial EEG (I-EEG)" or "sub-dural EEG (SD-EEG)". Depth electrodes may also be placed into brain structures, such as the amygdala or hippocampus, structures which are common epileptic foci and may not be "seen" clearly by scalp EEG. The electrocorticographic signal is processed in the same manner as digial scalp EEG (above), with a couple of caveats. ECoG is typically recorded at higher sampling rates than scalp EEG because of the requirements of Nyquist theorem—the sub-dural signal is composed of a higher predominance of higher frequency components. Also, many of the artifacts which affect scalp EEG do not impact ECoG, and therefore display filtering is often not needed.
A typical adult human EEG signal is about 10-100 µV in amplitude when measured from the scalp [2] and is about 10–20 mV when measured from subdural electrodes.
Since an EEG voltage signal represents a difference between the voltages at two electrodes, the display of the EEG for the reading encephalographer may be set up in one of several ways. The representation of the EEG channels is referred to as a montage.
- Bipolar montage
- Each channel (i.e., waveform) represents the difference between two adjacent electrodes. The entire montage consists of a series of these channels. For example, the channel "Fp1-F3" represents the difference in voltage between the Fp1 electrode and the F3 electrode. The next channel in the montage, "F3-C3," represents the voltage difference between F3 and C3, and so on through the entire array of electrodes.
- Referential montage
- Each channel represents the difference between a certain electrode and a designated reference electrode. There is no standard position at which this reference is always placed; it is, however, at a different position than the "recording" electrodes. Midline positions are often used because they do not amplify the signal in one hemisphere vs. the other. Another popular reference is "linked ears," which is a physical or mathematical average of electrodes attached to both earlobes or mastoids.
- Average reference montage
- The outputs of all of the amplifiers are summed and averaged, and this averaged signal is used as the common reference for each channel.
- Laplacian montage
- Each channel represents the difference between an electrode and a weighted average of the surrounding electrodes.
When analog (paper) EEGs are used, the technologist switches between montages during the recording in order to highlight or better characterize certain features of the EEG. With digital EEG, all signals are typically digitized and stored in a particular (usually referential) montage; since any montage can be constructed mathematically from any other, the EEG can be viewed by the electroencephalographer in any display montage that is desired.
Limitations
EEG has several limitations. Most important is its poor spatial resolution. EEG is most sensitive to a particular set of post-synaptic potentials: those which are generated in superficial layers of the cortex, on the crests of gyri directly abutting the skull and radial to the skull. Dendrites which are deeper in the cortex, inside sulci, are in midline or deep structures (such as the cingulate gyrus or hippocampus) or produce currents which are tangential to the skull have far less contribution to the EEG signal.
The meninges, cerebrospinal fluid and skull "smear" the EEG signal, obscuring its intracranial source.
It is mathematically impossible to reconstruct a unique intercranial current source for a given EEG signal, as some currents produce potentials that cancel each other out. This is referred to as the inverse problem. However, much work has been done to produce remarkably good estimates of, at least, a localized electric dipole that represents the recorded currents.
Advantages
EEG has several strong sides as a tool of exploring brain activity; for example, its time resolution is very high (on the level of a single millisecond). Other methods of looking at brain activity, such as PET and fMRI have time resolution between seconds and minutes. EEG measures the brain's electrical activity directly, while other methods record changes in blood flow (e.g., SPECT, fMRI) or metabolic activity (e.g., PET), which are indirect markers of brain electrical activity. EEG can be used simultaneously with fMRI so that high-temporal-resolution data can be recorded at the same time as high-spatial-resolution data, however, since the data derived from each occurs over a different time course, the data sets do not necessarily represent the exact same brain activity. There are technical difficulties associated with combining these two modalities, including the need to remove RF pulse artifact and ballistocardiographic artifact (a results from the movement of pulsed blood) from the EEG. Furthermore, currents can be induced in moving EEG electrode wires due to the magnetic field of the MRI.
EEG can be recorded at the same time as MEG so that data from these complimentary high-time-resolution techniques can be combined.
Normal activity


One second of EEG signal
The EEG typically described in terms of (1) rhythmic activity and (2) transients. The rhythmic activity is divided into bands by frequency. To some degree, these frequency bands are a matter of nomenclature (i.e., any rhythmic activity between 8-12 Hz can be described as "alpha"), but these designations arose because rhythmic activity within a certain frequency range was noted to have a certain distribution over the scalp or a certain biological significance.
Most of the cerebral signal observed in the scalp EEG falls in the range of 1-20 Hz (activity below or above this range is likely to be artifactual, under standard clinical recording techniques):

- Delta is the frequency range up to 3 Hz. It tends to be the highest in amplitude and the slowest waves. It is seen normally in adults in slow wave sleep. It is also seen normally in babies. It may occur focally with subcortical lesions and in general distribution with diffuse lesions, metabolic encephalopathy hydrocephalus or deep midline lesions. It is usually most prominent frontally in adults (e.g. FIRDA - Frontal Intermittent Rhythmic Delta) and posteriorly in chilldren e.g. OIRDA - Occipital Intermittent Rhythmic Delta).

- Theta is the frequency range from 4 Hz to 7 Hz. Theta is seen normally in young children. It may be seen in drowsiness or arousal in older children and adults; it can also be seen in meditation. Excess theta for age represents abnormal activity. It can be seen as a focal disturbance in focal subcortical lesions; it can be seen in generalized distribution in diffuse disorder or metabolic encephalopathy or deep midline disorders or some instances of hydrocephalus.

- Alpha is the frequency range from 8 Hz to 12 Hz. Hans Berger named the first rhythmic EEG activity he saw, the "alpha wave." This is activity in the 8-12 Hz range seen in the posterior regions of the head on both sides, being higher in amplitude on the dominant side. It is brought out by closing the eyes and by relaxation. It was noted to attenuate with eye opening or mental exertion. This activity is now referred to as "posterior basic rhythm," the "posterior dominant rhythm" or the "posterior alpha rhythm." The posterior basic rhythm is actually slower than 8 Hz in young children (therefore technically in the theta range). In addition to the posterior basic rhythm, there are two other normal alpha rhythms that are typically discussed: the mu rhythm and a temporal "third rhythm". Alpha can be abnormal; for example, an EEG that has diffuse alpha occurring in coma and is not responsive to external stimuli is referred to as "alpha coma".

- Mu rhythm is alpha-range activity that is seen over the sensorimotor cortex. It characteristically attenuates with movement of the contralateral arm (or mental imagery of movement of the contralateral arm).

- Beta is the frequency range from 12 Hz to about 30 Hz. It is seen usually on both sides in symmetrical distribution and is most evident frontally. Low amplitude beta with multiple and varying frequencies is often associated with active, busy or anxious thinking and active concentration. Rhythmic beta with a dominant set of frequencies is associated with various pathologies and drug effects, especially benzodiazepines. Activity over about 25 Hz seen in the scalp EEG is rarely cerebral (i.e., it is most often artifactual). It may be absent or reduced in areas of cortical damage. It is the dominant rhythm in patients who are alert or anxious or who have their eyes open.

- Gamma is the frequency range approximately 26–100 Hz. Because of the filtering properties of the skull and scalp, gamma rhythms can only be recorded from electrocorticography or possibly with magnetoencephalography. Gamma rhythms are thought to represent binding of different populations of neurons together into a network for the purpose of carrying out a certain cognitive or motor function.
"Ultra-slow" or "near-DC" activity is recorded using DC amplifiers in some research contexts. It is not typically recorded in a clinical context because the signal at these frequencies is susceptible to a number of artifacts.
Some features of the EEG are transient rather than rhythmic. Spikes and sharp waves may represent seizure activity or interictal activity in individuals with epilepsy or a predisposition toward epilepsy. Other transient features are normal: vertex waves and sleep spindles are transient events which are seen in normal sleep.
It should also be noted that there are types of activity which are statistically uncommon but are not associated with dysfunction or disease. These are often referred to as "normal variants." The mu rhythm is an example of a normal variant.
The normal EEG varies by age. The neonatal EEG is quite different from the adult EEG. The EEG in childhood is generally comprised of slower frequency oscillations than the adult EEG.
The normal EEG also varies depending on state. The EEG is used along with other measurements (EOG, EMG) to define sleep stages in polysomnography. Stage I sleep (equivalent to drowsiness in some systems) appears on the EEG as drop-out of the posterior basic rhythm. There can be an increase in theta frequencies. Santamaria and Chiappa cataloged a number of the variety of patterns associated with drowsiness. Stage II sleep is characterized by sleep spindles--transient runs of rhythmic activity in the 12-14 Hz range (sometimes referred to as the "sigma" band) that have a frontal-central maximum. Most of the activity in Stage II is in the 3-6 Hz range. Stage III and IV sleep are defined by the presence of delta frequences and are often referred to collectively as "slow-wave sleep." Stages I-IV are comprise non-REM (or "NREM") sleep. The EEG in REM (rapid eye movement) sleep appears somewhat similar to the awake EEG.
EEG under general anesthesia depends on the type of anesthetic employed. With halogenated anesthetics, such as halothane or intravenous agents, such as propofol, a rapid (alpha or low beta), nonreactive EEG pattern is seen over most of the scalp, especially anteriorly; in some older terminology this was known as a WAR (widespread anterior rapid) pattern, contrasted with a WAIS (widespread slow) pattern associated with high doses of opiates. Anesthetic effects on EEG signals are beginning to be understood at the level of drug actions on different kinds of synapses and the circuits that allow synchronized neuronal activity (see: http://www.stanford.edu/group/maciverlab/).
Artifacts
Biological artifacts
Signals in the EEG that are of non-cerebral origin are called artifacts. The EEG is nearly always contaminated by such signals. This is one of the reasons why it takes considerable experience to interpret EEGs clinically. The most common types of artifacts are:
- Eye artifacts (including eyeball, ocular muscles and eyelid)
- EKG artifacts
- EMG artifacts
- Glossokinetic artifacts
Eyeball artifacts are caused by the potential difference between the cornea and retina, which is quite large compared to cerebral potentials. When the eye is completely still, this is not a problem. But there are nearly always small or large reflexive eye movements, which generates a potential which is picked up in the frontopolar and frontal leads. Eye movements - whether vertical or horizontal [saccades] - are caused by ocular muscles, which also generate electromyographic potentials. Purposeful or reflexive eye blinking also generates electromyographic potentials, but more importantly there is reflexive movement of the eyeball during blinking which gives a characteristic artefactual appearance of the EEG (see Bell's phenomenon).
Eyelid fluttering artifacts of a characteristic type were previously called Kappa rhythm (or Kappa waves). It is usually seen in the prefrontal leads, that is, just over the eyes. Sometimes they are seen with mental activity. They are usually in the Theta (4–7 Hz) or Alpha (8–13 Hz) range. They were named because they were believed to originate from the brain. Later study revealed they were generated by rapid fluttering of the eyelids, sometimes so minute that it was difficult to see. They are in fact noise or "artifact" in the EEG reading, and should not technically be called a rhythm or wave. Therefore, the term Kappa rhythm (or wave) is no longer used in electroencephalography. It should be described as eyelid fluttering artifact.[3]
Some of these artifacts are useful. Eye movements are very important in polysomnography, and is also useful in conventional EEG for assessing possible changes in alertness, drowsiness or sleep.
EKG artifacts are quite common and can be mistaken for spike activity. Because of this, modern EEG acquisition commonly includes a one-channel EKG from the extremities. This also allows the EEG to identify cardiac arrythmias that are an important differential diagnosis to syncope or other episodic/attack disorders. Glossokinetic artifacts are caused by the potential difference between the base and the tip of the tongue. Minor tongue movements can contaminate the EEG, especially in parkinsonian and tremor disorders.
External artifacts
In addition to internal artifacts, there are many artifacts which originate from outside the patient. Movement by the patient, or even just settling of the electrodes, may cause electrode pops, spikes originating from a momentary change in the impedance of a given electrode. Poor grounding of the EEG electrodes can cause significant 50 or 60Hz artifact, depending on the local power system's frequency. A third source of possible interference can be the presence of an IV drip; such devices can cause rhythmic, fast, low-voltage bursts, which may be confused for spikes.
Artifact correction
Recently, source decomposition techniques have been used to correct or remove EEG contaminates. These techniques attempt to "unmix" the EEG signals into some number of underlying components. There are many source separation algorithms, often assuming various behaviors or natures of EEG. Regardless, the principle behind any particular method usually allow "remixing" only those components that would result in "clean" EEG by nullifying (zeroing) the weight of unwanted components.
Abnormal Activity
Abnormal activity can broadly be separated into epileptiform and non-epileptiform activity. It can also be separated into focal or diffuse.
Focal epileptiform discharges represent fast, synchronous potentials in a large number of neurons in a somewhat discrete area of the brain. These can occur as inter-ictal activity, between seizures, and represent an area of cortical irritability that may be predisposed to producing epileptic seizures. Inter-ictal discharges are not wholly reliable for determining whether a patient has epilepsy nor where his/her seizure might originate. (See focal epilepsy.)
Generalized epileptiform discharges often have an anterior maximum, but the are seen synchronously throughout the entire brain. They are strongly suggestive of a generalized epilepsy.
Focal non-epileptiform abnormal activity may occur over areas of the brain where there is focal damage of the cortex or white matter. It often consists of an increase in slow frequency rhythms and/or a loss of normal higher frequency rhythms. It may also appear as focal or unilateral decrease in amplitude of the EEG signal.
Diffuse non-epileptiform abnormal activity may manifest as diffuse abnormally slow rhythms or bilateral slowing of normal rhythms, such as the PBR.
History
A timeline of the history of EEG is given by Swartz.[4] Richard Caton (1842–1926), a physician practicing in Liverpool, presented his findings about electrical phenomena of the exposed cerebral hemispheres of rabbits and monkeys in the British Medical Journal in 1875. In 1890, Beck published an investigation of spontaneous electrical activity of the brain of rabbits and dogs which included rhythmic oscillations altered by light.
In 1912, Russian physiologist, Vladimir Vladimirovich Pravdich-Neminsky published the first EEG and the evoked potential of the mammalian (dog).[5] In 1914, Cybulsky and Jelenska-Macieszyna photographed EEG-recordings of experimentally induced seizures.
German physiologist Hans Berger (1873–1941) began his studies of the human EEG in 1920. He gave the device its name and is sometimes credited with inventing the EEG, though others had performed similar experiments. His work was later expanded by Edgar Douglas Adrian.
In 1934, Fisher and Lowenback first demonstrated epileptiform spikes. In 1935 Gibbs, Davis and Lennox described interictal spike waves and the 3 cycles/s pattern of clinical absence seizures, which began the field of clinical electroencephalography. Subsequently, in 1936 Gibbs and Jasper reported the interictal spike as the focal signature of epilepsy. The same year, the first EEG laboratory opened at Massachusetts General Hospital.
Franklin Offner (1911–1999), professor of biophysics at Northwestern University developed a prototype of the EEG which incorporated a piezoelectronic inkwriter called a Crystograph (the whole device was typically known as the Offner Dynograph).
In 1947, The American EEG Society was founded and the first International EEG congress was held. In 1953 Aserinsky and Kleitmean describe REM sleep.
In the 1950s, English physician William Grey Walter developed an adjunct to EEG called EEG topography which allowed for the mapping of electrical activity across the surface of the brain. This enjoyed a brief period of popularity in the 1980s and seemed especially promising for psychiatry. It was never accepted by neurologists and remains primarily a research tool.
Various uses
The EEG has been used for many purposes besides the conventional uses of clinical diagnosis and conventional cognitive neuroscience. Neurofeedback remains an important extension, and in its most advanced form is also attemped as the basis of brain computer interfaces. There are many commercial products substantially based on the EEG.
For example, as of March 24th 2007 a US company called Emotiv Systems launched a mind controlled device for video games based on Electroencephalography.[6].
See also
- Brain-computer interface
- Brainwave synchronization
- Brainwave Frequencies
- Binaural beats
- Cranial Electrobiological Stimulation
- EEG-fMRI
- Electrical activity
- Evoked potential
- Event-related potential
- Hemoencephalography
- Induced activity
- Local field potentials
- Magnetoencephalography
- Mind machine
- Neurofeedback
- Neural oscillations
- Ongoing brain activity
- Rheoencephalography
References
- ↑ G. Ruffini, S. Dunne, L. Fuentemilla, C. Grau, E. Farres, J. Marco-Pallares, P. C. P. Watts, S. R. P. Silva (01 2007). First human trials of a dry electrophysiology sensor using a carbon nanotube array interface.. arXiv.org (arXiv:physics/0701159v1).
- ↑ H. Aurlien, I.O. Gjerde, J. H. Aarseth, B. Karlsen, H. Skeidsvoll, N. E. Gilhus (03 2004). EEG background activity described by a large computerized database.. Clinical Neurophysiology 115 (3): 665-673.
- ↑ Epstein, Charles M. (1983). Introduction to EEG and evoked potentials, J. B. Lippincot Co.. ISBN 0-397-50598-1.
- ↑ Swartz, B.E (1998). Timeline of the history of EEG and associated fields. Electroencephalography and clinical Neurophysiology 106: 173–176.
- ↑ Pravdich-Neminsky VV. Ein Versuch der Registrierung der elektrischen Gehirnerscheinungen (In German). Zbl Physiol 27: 951–960, 1913.
- ↑ Reporter: Don Clark (2007). Video Mind Control Device. URL accessed on 2007-03-25.
Electroencephalography (EEG) | |
|---|---|
| Related tests | |
| Evoked potentials | |
| Neural oscillations | |
| Topics | |
External links
- The open-source programmable chip Electroencephalography project
- The world's largest manufacturer of data acquisition/biofeedback devices
- The programmable chip Electroencephalography project open circuits wiki
- The programmable chip Electroencephalography project WikiCities wiki
- The open-source Electroencephalography project
- BioEra - Cross-Platform EEG Software, of which there is a free software version (BioEra GPL), and a proprietary software version.
- International Federation of Clinical Neurophysiology
- The EEG and Clinical Neuroscience Society
- American Clinical Neurophysiology Society
- Brain Slice EEG models
- BrainWave Lab - Sound Therapy
- includeonly>"Epileptic Brain Waves", Time Magazine, 1935-04-22. Retrieved on 2006-09-05.
| This page uses Creative Commons Licensed content from Wikipedia (view authors). |